Address
304 North Cardinal St.
Dorchester Center, MA 02124
Work Hours
Monday to Friday: 7AM - 7PM
Weekend: 10AM - 5PM

Address
304 North Cardinal St.
Dorchester Center, MA 02124
Work Hours
Monday to Friday: 7AM - 7PM
Weekend: 10AM - 5PM
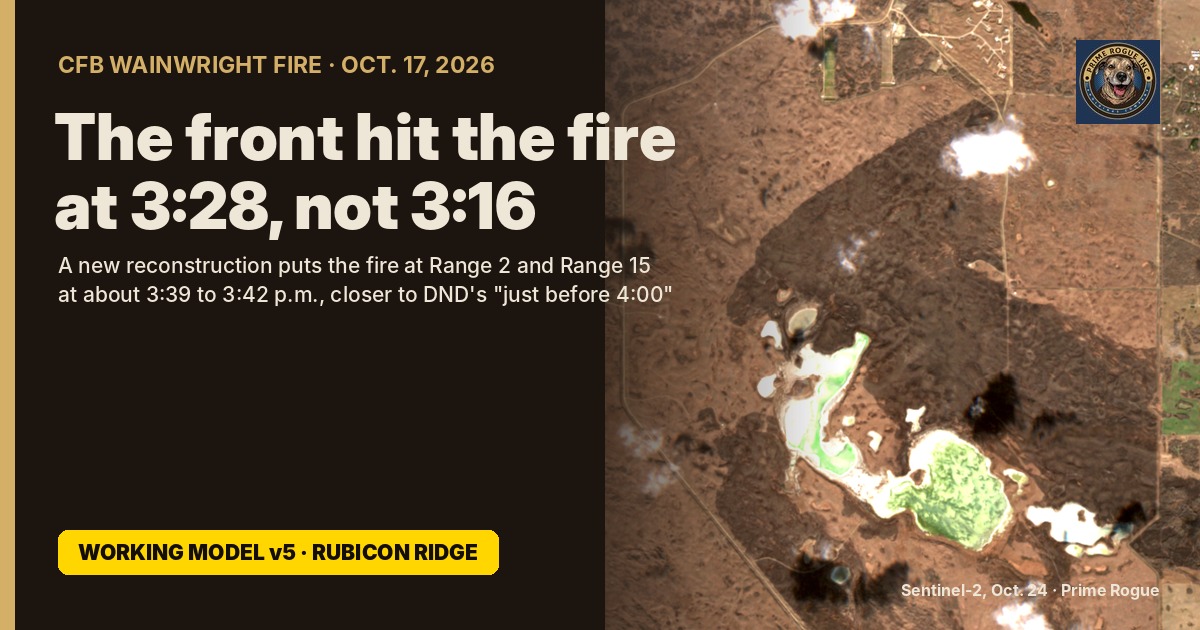
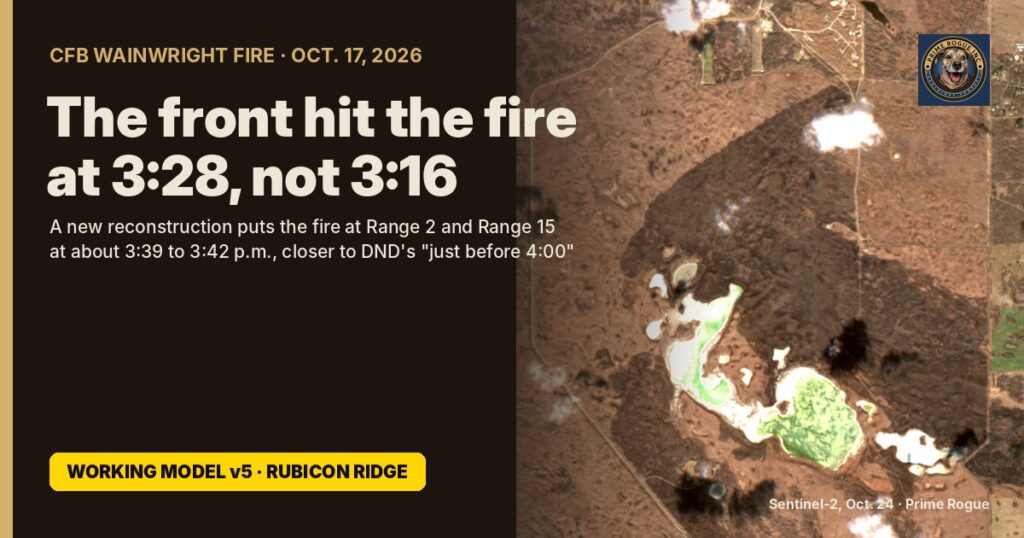
The cold front that turned the Oct. 17 fire at CFB Wainwright reached the fire at about 3:28 p.m., according to Prime Rogue’s new reconstruction, working model v5, “Rubicon Ridge”. Our previous model, v4, used 3:16 p.m., the time of the 82 km/h gust at the base’s weather station. That station is about 15 km west-northwest of the fire, and the front took about 12 minutes to cross the gap.
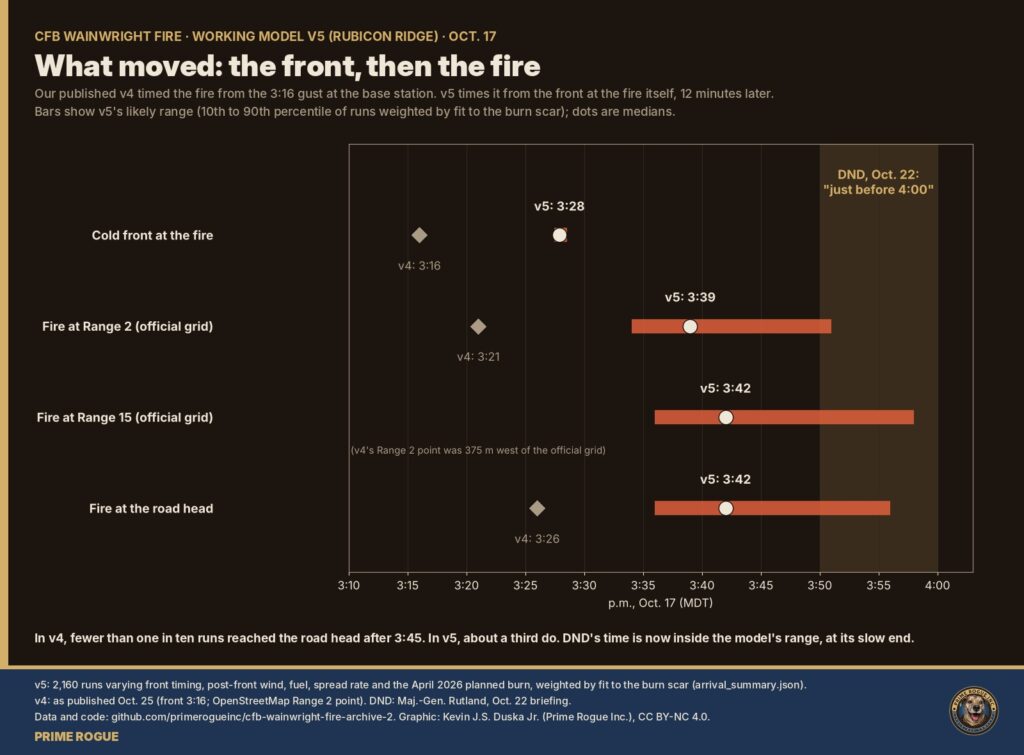
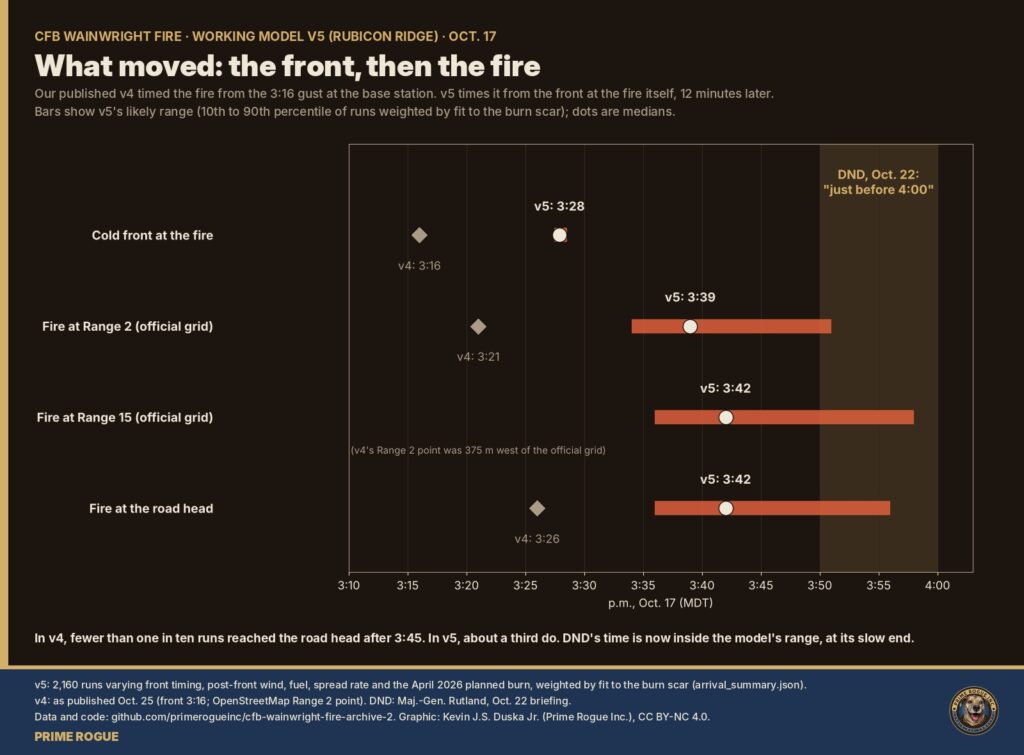
The later front moves the fire’s likely arrival at the two ranges named in the base’s own range orders to about 3:39 p.m. at Range 2 and 3:42 p.m. at Range 15. v4 put the fire at Range 2 at about 3:21. Measured from the moment the front hit, the fire’s run takes about as long as before: roughly 10 to 13 minutes to those points.
That narrows the gap with DND’s account. DND has said the soldiers were overtaken “just before 4:00”, the latest in a series of accounts of the afternoon. In v4, fewer than one in ten model runs reached the road head after 3:45. In v5, about a third do, depending on how fast the fire ran after the front, the biggest unknown left.
This update also corrects five things we published, set out in the next section. v5 is a working model, not a final finding. Its data and code are public. For everything we’ve published on the fire, start with our live updates page
Five figures we published were wrong or imprecise, and two model results have changed. We have corrected the archive files, and each change is recorded in our public corrections. v4 stays available exactly as published at the v4-published repository
| What we published | Correct figure | Why |
| The cold front reached the fire at 3:16 p.m. | About 3:28 p.m. (3:27 to 3:29) | 3:16 was the gust at the base weather station, not at the fire. A line fitted to nine stations and sensors puts the front over the fire 12 minutes later. |
| The base weather station is about 12 km (or 13 km, or 15 km west) from the fire | 14.7 km west-northwest | Measured from the fire centre (52.7645 N, 110.9052 W) to the station (CZWN). Our files gave three different figures. |
| GOES satellite pixels are about 2 km across | Several km: about 2.6 by 5 km at the fire | The 2 km figure is nominal. At Wainwright’s steep viewing angle the heat-sensing pixels are much larger. |
| The burn covers about 11.5 to 11.7 square km | About 1,050 to 1,100 ha | Earlier totals included a separate patch, probably the Oct. 14 fire. The 70 cm outline gives 1,050 ha net of unburned islands inside the image, about 1,075 ha for the whole burn. |
| DND’s “approximately 4:00 p.m.” release was dated Oct. 17 | Dated Oct. 18 | A date error in one of our analysis notes. |
One wording fix: Environment Canada’s 2:14 p.m. bulletin did not issue a new warning. It added Wainwright to a wind warning in force for areas to the west since 11:42 a.m.
The front swept across the region from the west-northwest at about 77 km/h and reached the fire at about 3:28 p.m. It arrived at stations to the west and north first and at those to the south and east last.
| Station or sensor | Distance and direction from the fire | Front arrival (MDT) | Peak gust (time) | Temperature fall |
| Albert Hall | 43 km NNW | about 3:02 | 82 km/h (3:07) | 22.9 to 12.7 °C |
| Bellshill | 43 km WSW | about 3:02 | 81 km/h (3:25) | 23.0 to 12.7 °C |
| Castor (air sensor) | 91 km SW | 3:07 | — | — |
| CFB Wainwright (CZWN) | 14.7 km WNW | 3:16 | 82 km/h (3:16) | 23.3 to 12.9 °C |
| Wainwright town (air sensor) | 8 km NNE | 3:28 | — | — |
| The fire | — | about 3:28 (3:27 to 3:29) | — | — |
| Gilt Edge North | 39 km NNE | about 3:30 | 83 km/h (3:28) | 23.5 to 14.1 °C |
| Coronation | 85 km SSW | 3:31 | 94.6 km/h (3:33) | 22.1 to 13.7 °C |
| Hughenden (nearest station) | 22 km SSE | about 3:39 | 77 km/h (3:43) | 23.1 to 13.8 °C |
| Lloydminster | 82 km NE | about 3:45 (3:41 to 3:48) | 98 km/h (3:48) | 22.8 to 15.1 °C |
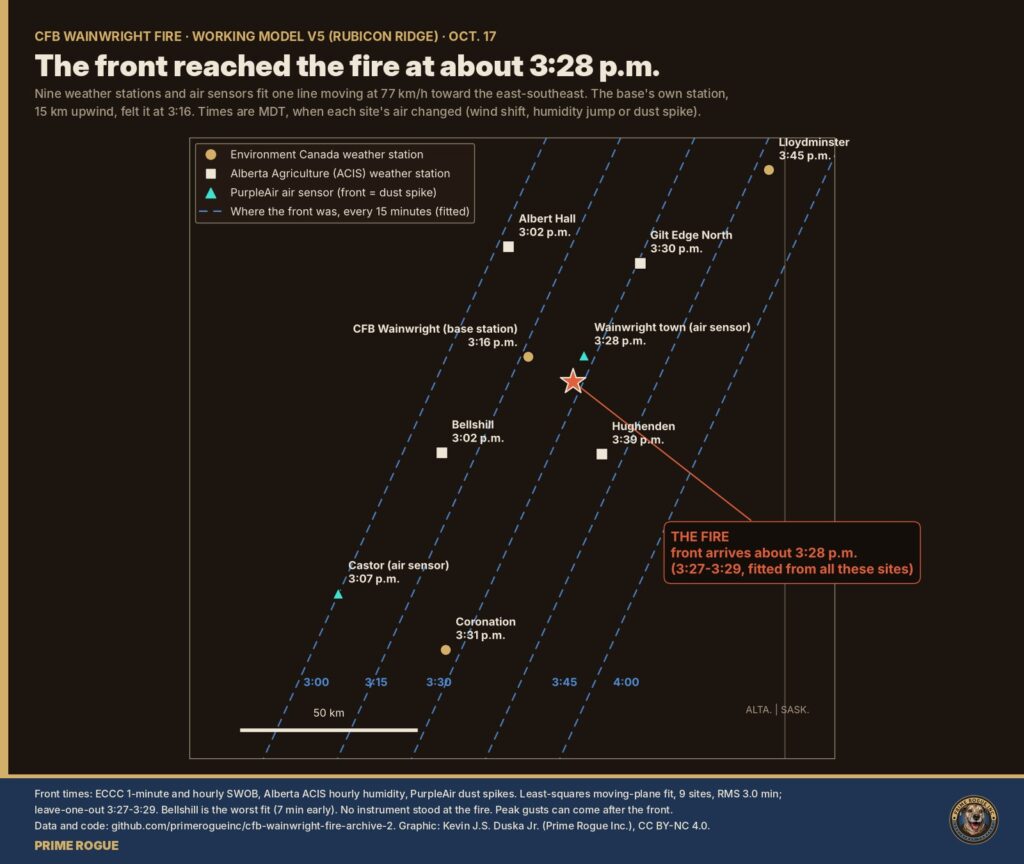
Front arrival is when the air mass changed at each site: – the wind shift at stations with minute-by-minute data (Environment and Climate Change Canada); – the jump in humidity at hourly stations (Alberta Climate Information Service); – the dust spike at the two air sensors (PurpleAir).
The fire’s time comes from a moving line fitted to these nine sites (average miss 3 minutes). No instrument stood at the fire itself. Bellshill is the worst fit: it turned about 7 minutes earlier than the line predicts.
The peak gust at a station can come well after the front, as it did at Bellshill. Peak gusts are 2 m or 10 m readings as reported, and gusts are not the sustained wind that drives a fire.
The front’s arrival at the base station at 3:16 is real. It is the 3:16 we and others reported. It just happened about 15 km upwind of the fire.
On v5, the fire reached the official Range 2 grid at about 3:39 p.m. and Range 15 at about 3:42, roughly 10 to 13 minutes after the front hit. How fast it ran after the front is the biggest unknown, and it moves those times by up to 15 minutes.
v5 runs 2,160 versions of the fire. They vary the front’s timing, the wind after the front, the grass type, the spread rate, and how much the April 2026 planned burn slowed it. Each is weighted by how well its final shape matches the actual burn scar. The full results are in the v5 model folder.
| Point | v4 (published Oct. 25) | v5 median | Likely range (10 to 90%) | Share reached 3:45 to 4:00 |
| Range 2 (official grid) | not modelled (v4 used a point 375 m west: 3:21) | 3:39 p.m. | 3:34 to 3:51 | 25% |
| Range 15 (official grid) | not modelled | 3:42 p.m. | 3:36 to 3:58 | 31% (plus 7% after 4:00) |
| Road head (entrance to Range 15) | 3:26 p.m. | 3:42 p.m. | 3:36 to 3:56 | 30% (plus 5% after 4:00) |
Spread rate decides the clock. The burn scar cannot tell a fast fire from a slow one: both leave the same shape. So v5 brackets it:
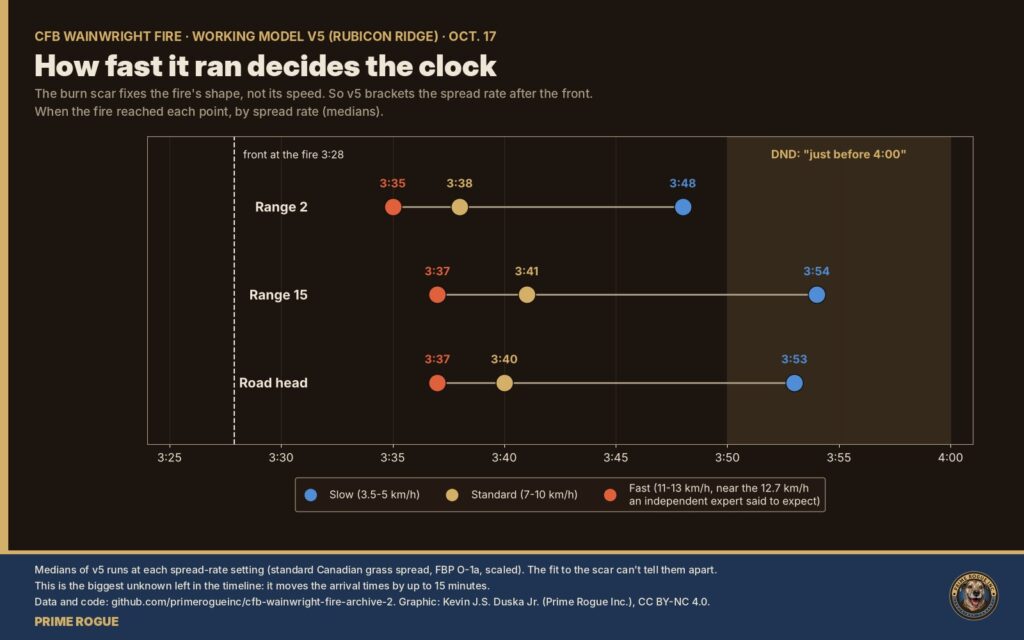
| Spread rate after the front | Range 2 | Range 15 | Road head |
| Slow, 3.5 to 5 km/h | 3:48 | 3:54 | 3:53 |
| Standard, 7 to 10 km/h | 3:38 | 3:41 | 3:40 |
| Fast, 11 to 13 km/h (near the 12.7 km/h an independent wildfire expert said to expect) | 3:35 | 3:37 | 3:37 |
Two other findings: – The wind after the front. The wind that best reproduces the scar blew from the north-west (310 to 315 degrees), as in v4. – The April 2026 planned burn. The ground burned in it did not clearly slow the fire: giving it a lower spread rate makes the fit slightly worse.
What this means for “just before 4:00”. v4 found DND’s time hard to square with the model: fewer than one in ten runs reached the road head after 3:45. v5 narrows that gap. A slow-running fire reaches Range 15 at about 3:54, and about a third of weighted runs reach it between 3:45 and 4:00. DND’s time is now within the model’s range, at its slow end
The Canadian Armed Forces has said the fire was about a kilometre away when the wind shifted and covered that distance in 30 to 60 seconds. That is the speed of the wind front, not of the flames.
A fire can seem to arrive in seconds without its front moving that fast, in three ways: – smoke and dust hide the flames until they are close; – embers start spot fires ahead of the main front; – a long flank turns into a head fire all at once when the wind veers, the scenario our Oct. 19 analysis of satellite imagery explored.
The data cannot say which, if any, happened here. What it does show is that the wind front, with its dust and the sudden gusts, covered a kilometre in under a minute.
The air-quality spike recorded in Wainwright at about 3:28 p.m. was wind-blown dust carried by the front, not smoke from the fire.
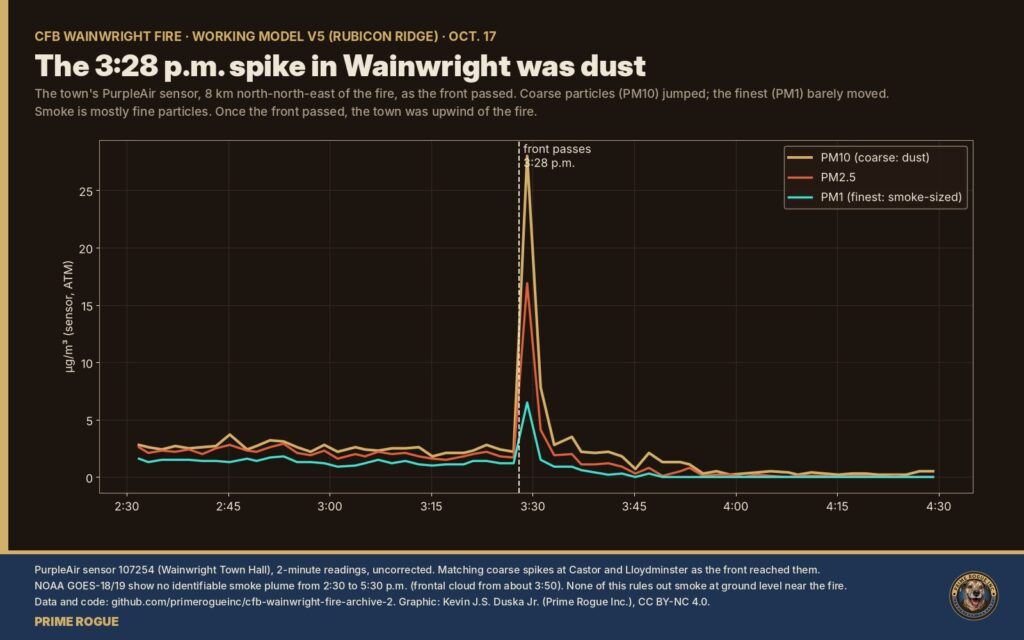
None of this rules out smoke on the ground. It means the instruments that might have recorded it were in the wrong place, under cloud, or between passes.
The fire burned about 1,050 to 1,100 ha, stopped just short of both official range grids, and crossed the base’s eastern boundary near its south-east corner. These measurements come from Prime Rogue’s 70 cm satellite image of Oct. 20, published here.
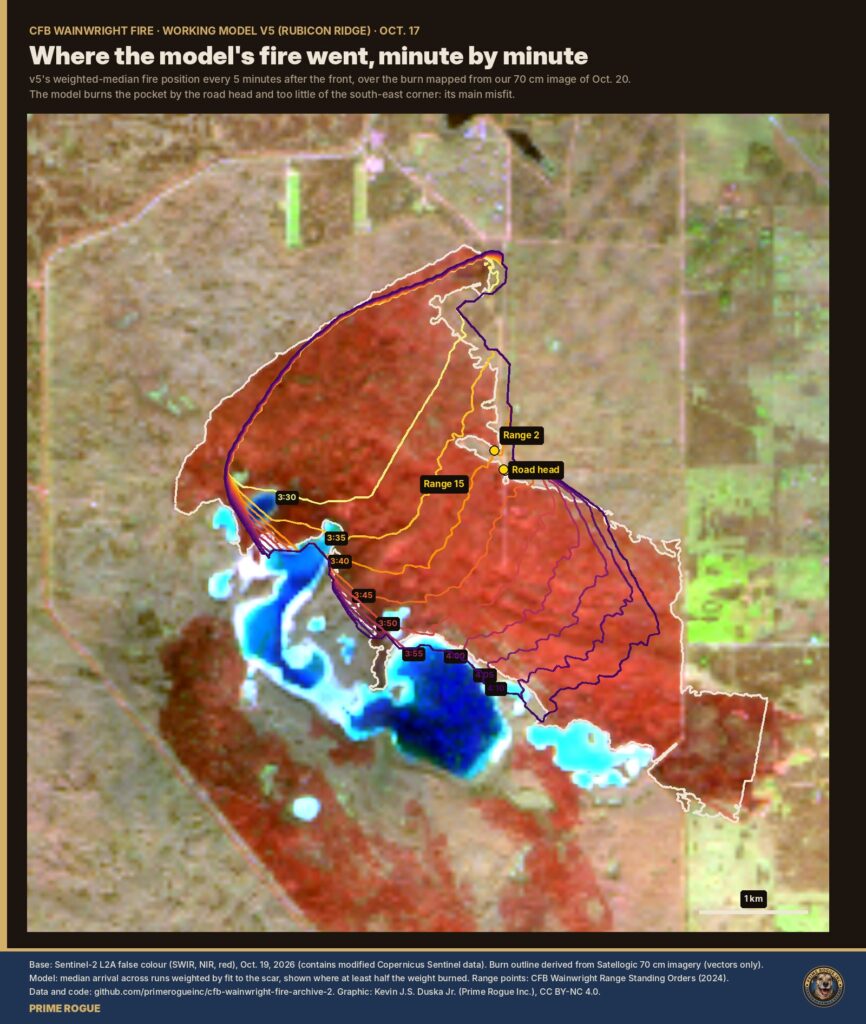
The model does not know about tracks or bare strips, so it burns the pocket by the road head and too little of the south-east corner. That is v5’s main misfit, and it points to local features such as tracks, fuel breaks or suppression that the model does not include.
v5 narrows when the fire reached the ranges. It cannot say where the soldiers were or exactly when they were overtaken.
v5 is a working model. New data, or DND’s own records, may confirm or overturn it.
On Oct. 27, Prime Rogue sent DND these questions, on top of the access-to-information requests we’ve filed – which range was the pairs range; – when the fire reached it, according to DND’s records; – whether tracks were used as fireguards; – when the base fire hall was dispatched.
DND has not responded to eight requests for comment.
DND’s account so far comes from its Oct. 22 briefing (our archived transcript): the fire began on the automatic grenade launcher range, was monitored inside the danger area, and overtook soldiers on a pairs range “just before 4:00” after the wind shifted. That account came days after DND first said the fire “ignited” at about 4 p.m., although satellites had detected it hours earlier. Several investigations are under way, military and provincial.
Sumerian Oil & Gas Inc., formerly Cleo Energy Corp., holds about two-thirds of the roughly 260 licensed well sites on CFB Wainwright, Bloomberg reported. Its wells and gas gathering lines are the nearest to the ranges.
Prime Rogue has asked the Alberta Energy Regulator and the Orphan Well Association: – which of Sumerian’s wells, lines and facilities on the base had been shut in and secured by Oct. 17; – whether any have been inspected since the fire; – why the company has not been given access.
We will add their answers when they come.
Rubicon Ridge is the first of a series. Each part tests one piece of what happened on Oct. 17, and each is a working model that later data can confirm or overturn.
v5 is a 40 m grid fire-spread model using the Canadian Forest Fire Behaviour Prediction System for grass, run 2,160 times and weighted by fit to the burn scar. Full method, limits and code are in the archive.
Prime Rogue’s data, analysis and figures are CC BY-NC 4.0. Weather data: Environment and Climate Change Canada and Alberta Agriculture and Irrigation (Open Government Licence). Satellite data: NOAA.
 Exclusive: CFB Wainwright Satellite Images Show The CFB Wainwright Pairs Range After The Fire
 A week of satellite data on the CFB Wainwright fire: burning by 2:49 p.m., likely since morning
 The Noon Photograph: What Landsat Shows About Where The CFB Wainwright Fire Started, and The Gas Lines It Crossed
 A Reader’s Guide to the CFB Wainwright Fire: Base Map; Ranges; Garrison


[…] federal legislation allows Alberta’s Fatality Inquiries Act to apply on military […]
[…] Canada’s active military can’t yet fill the recruitment target it set in 2017. The proposed Supplementary Reserve would add a tier nearly four times larger than the entire current Regular Force — the scale gap the government hasn’t yet explained how it will close. […]
[…] tremendous resources and the GIUK Gap, a Royal Canadian Air Force CC-130J Hercules quietly flew to Canada’s northernmost military installation as Denmark has been increasing its military presence in […]