Address
304 North Cardinal St.
Dorchester Center, MA 02124
Work Hours
Monday to Friday: 7AM - 7PM
Weekend: 10AM - 5PM

Address
304 North Cardinal St.
Dorchester Center, MA 02124
Work Hours
Monday to Friday: 7AM - 7PM
Weekend: 10AM - 5PM
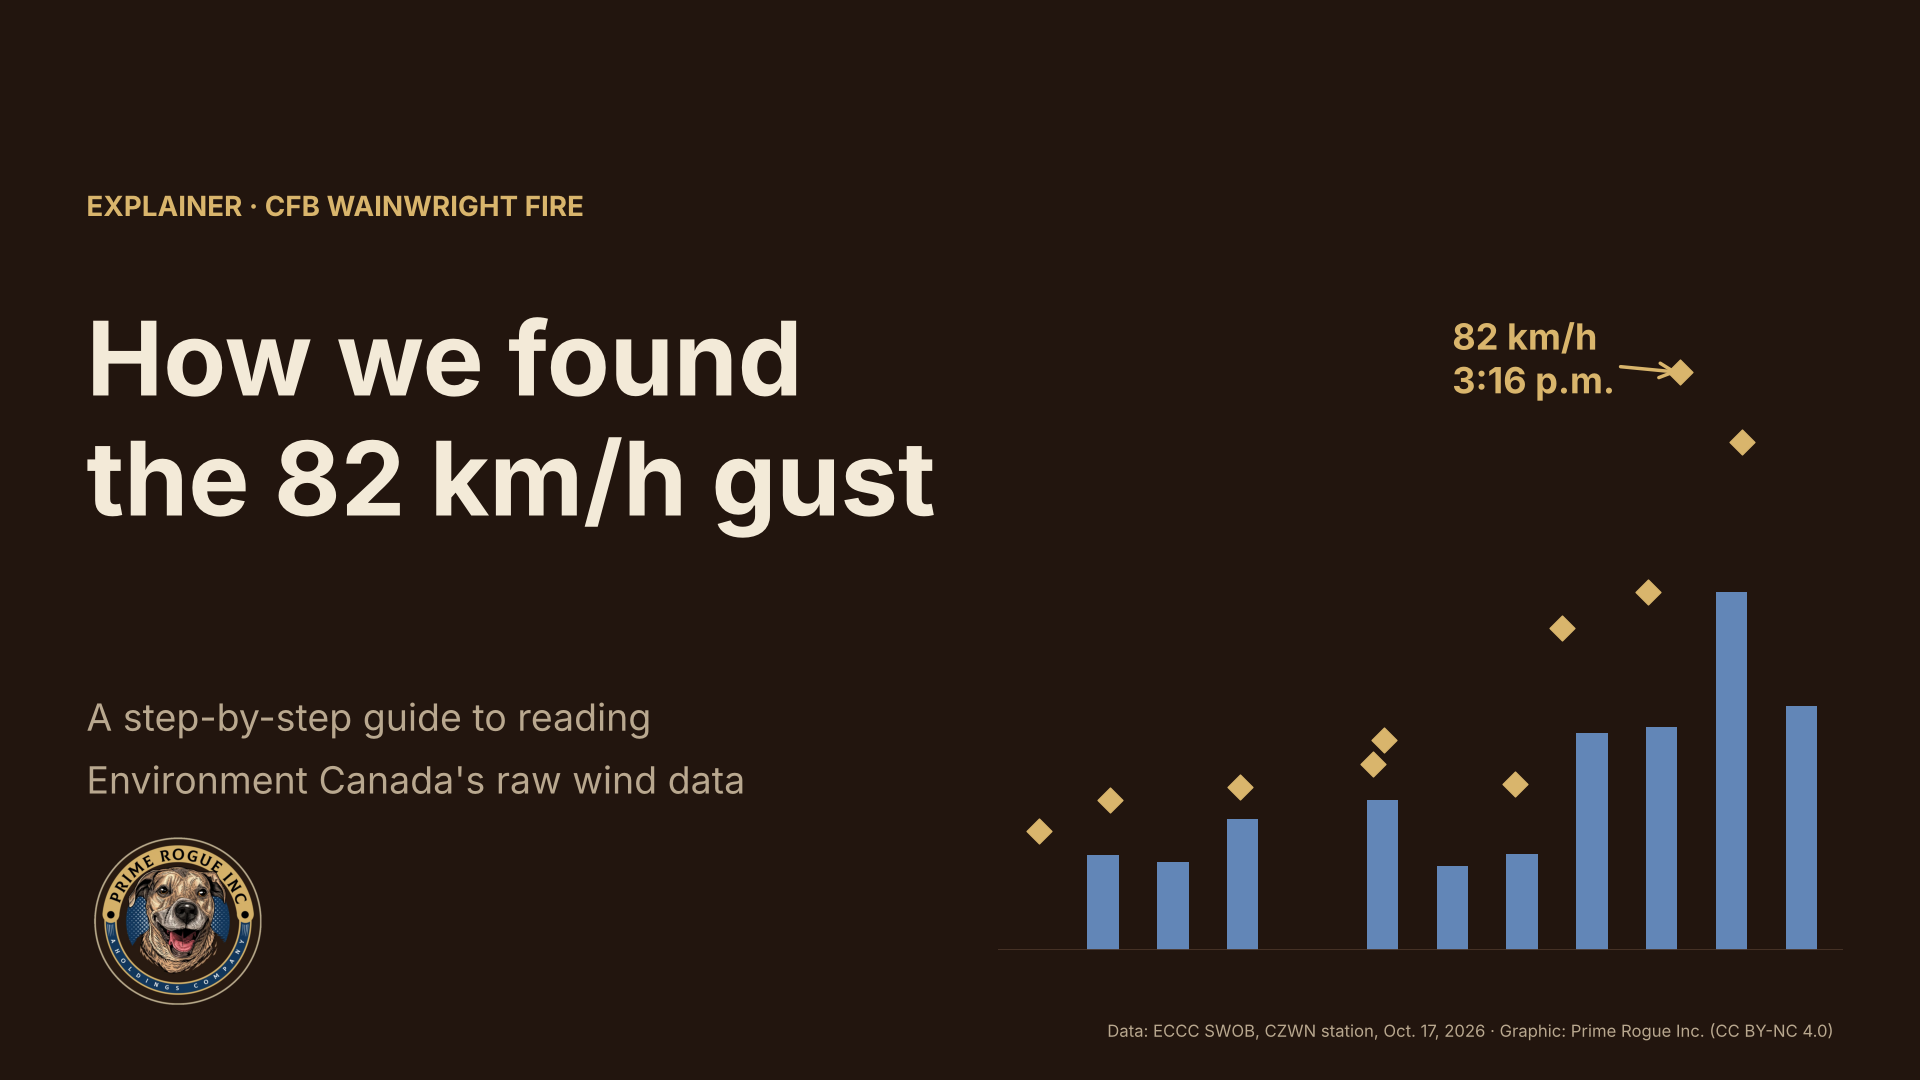
The strongest wind recorded near the CFB Wainwright fire on Oct. 17, 2026, was an 82 km/h gust from the west at 3:16 p.m. MDT, logged by the base’s own Environment Canada weather station. That number has been reported widely, but it does not appear in the hourly weather tables most people check, and another journalist queried Environment and Climate Change Canada where it comes from, and ECCC declined to comment. ECCC is, at present, declining to comment on the accuracy of its own weather data. (everyone should drop Ash a follow – she is a dogged advocate for transparency) It is, however, central to our live coverage of the fire, because it bears on when the wind turned and whether that change was foreseeable. As such, we determined it would be wise to provide the public with a guide to calculating the value on its own.
This explainer answers that, step by step. It shows which file the reading is in, how to read it, how to check it independently, and what it can and cannot tell us. Every file used here is public, and our archived copies are on GitHub, unaltered and timestamped, so anyone can repeat the work. At Prime Rogue, we firmly believe that data-driven journalism is important, and we will continue to strive to make it as publicly accessible as possible.
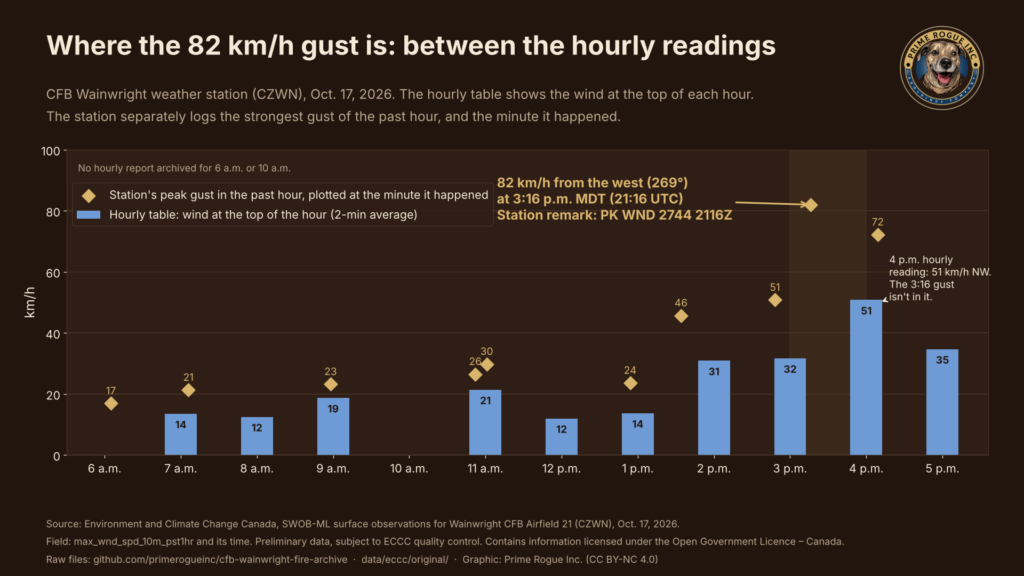
An automatic weather station reports two different wind measurements, and confusing them explains most of the puzzle.
So a gust at 3:16 p.m. falls between the 3 p.m. and 4 p.m. hourly readings. It will not appear in the hourly table, but it will appear in the day’s maximum-gust summary. That is exactly the gap another journalist spotted: the monthly summary shows 82 km/h, while the hourly table tops out at about half that.
The peak gust lives in Environment Canada’s SWOB files (Surface Weather Observations), published on the Meteorological Service of Canada’s open Datamart. Each automatic station posts one small XML file per hour, and each file holds every field the station measured.
The station that matters here is Wainwright CFB Airfield 21, station code CZWN (climate ID 301S001). Its files are named by date, UTC hour and station, so the report we need is:
2026-10-17-2200-CZWN-AUTO-swob.xml
That is the report filed at 22:00 UTC, which is 4 p.m. MDT, and it covers the hour from 3 to 4 p.m.
One catch: the Datamart keeps these files for only about 30 days before they roll off. We downloaded the Oct. 16 to 18 files on Oct. 19 and archived them unchanged. Our copy of the 4 p.m. report is the one used below.
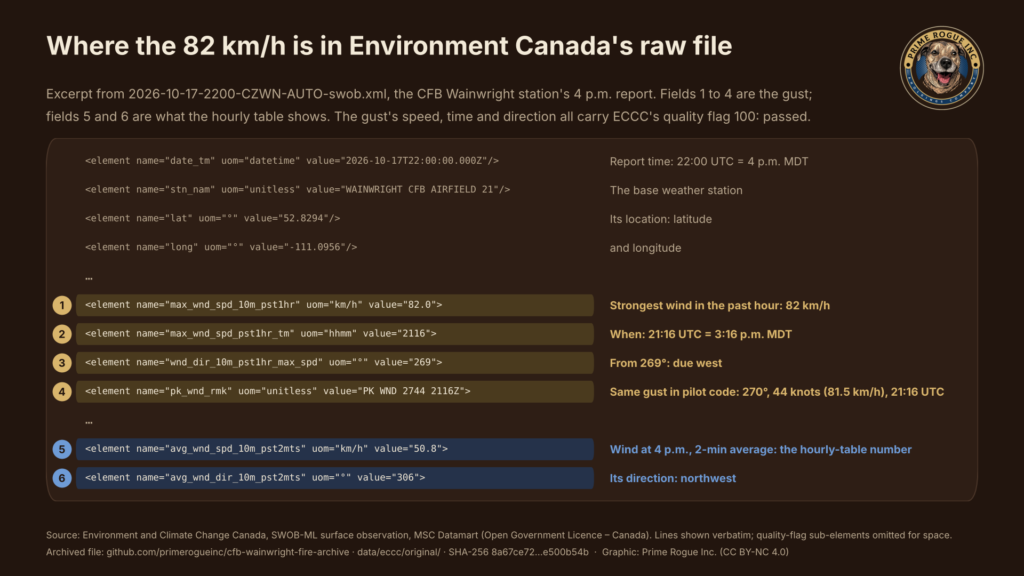
Open the XML file in any text editor or browser. Most of it is metadata. Six lines carry the wind story, copied here exactly as they appear:
<element name="max_wnd_spd_10m_pst1hr" uom="km/h" value="82.0">
<element name="max_wnd_spd_pst1hr_tm" uom="hhmm" value="2116">
<element name="wnd_dir_10m_pst1hr_max_spd" uom="°" value="269">
<element name="pk_wnd_rmk" uom="unitless" value="PK WND 2744 2116Z">
<element name="avg_wnd_spd_10m_pst2mts" uom="km/h" value="50.8">
<element name="avg_wnd_dir_10m_pst2mts" uom="°" value="306">| Field | Value | What it means |
|---|---|---|
max_wnd_spd_10m_pst1hr | 82.0 km/h | Strongest wind in the past hour, measured 10 m above ground |
max_wnd_spd_pst1hr_tm | 2116 | Time of that peak, in UTC (hours and minutes) |
wnd_dir_10m_pst1hr_max_spd | 269° | Direction the peak came from (270° is due west) |
pk_wnd_rmk | PK WND 2744 2116Z | The same peak in standard aviation shorthand (Step 4) |
avg_wnd_spd_10m_pst2mts | 50.8 km/h | The two-minute average at 4 p.m.: the hourly-table number |
avg_wnd_dir_10m_pst2mts | 306° | Its direction: northwest |
The last two rows are what the hourly table records for 4 p.m. The first three are the gust it leaves out.
The pk_wnd_rmk field gives a second, independent way to confirm the number. It uses the peak-wind code pilots read in airport weather reports:
Convert the speed: 44 knots × 1.852 = 81.5 km/h. That matches the 82.0 km/h in the main field once you allow for rounding to whole knots. The direction and time match too. Two separately encoded fields saying the same thing make a transcription or parsing error very unlikely.
SWOB times are in UTC. On Oct. 17, Alberta was on Mountain Daylight Time, six hours behind UTC, so 21:16 UTC is 3:16 p.m. MDT.
Repeating Steps 3 and 4 for each hourly file gives the full afternoon. The peak gusts climbed through the early afternoon, then jumped as the cold front arrived:
| Time (MDT) | Peak gust | From | Station remark |
|---|---|---|---|
| 1:34 p.m. | 45.7 km/h | 232° (southwest) | PK WND 2325 1934Z |
| 2:48 p.m. | 50.8 km/h | 246° (west-southwest) | PK WND 2527 2048Z |
| 3:16 p.m. | 82.0 km/h | 269° (west) | PK WND 2744 2116Z |
| 4:09 p.m. | 72.2 km/h | 288° (west-northwest) | PK WND 2939 2209Z |
The front shows up in the other fields too. Between the 3 p.m. and 4 p.m. reports, the temperature fell from 23.3 °C to 12.9 °C, humidity rose from 17% to 43%, and the wind swung from southwest to northwest.
The chart puts both kinds of numbers on one timeline: the hourly readings as bars, and each peak gust as a diamond at the minute it happened.
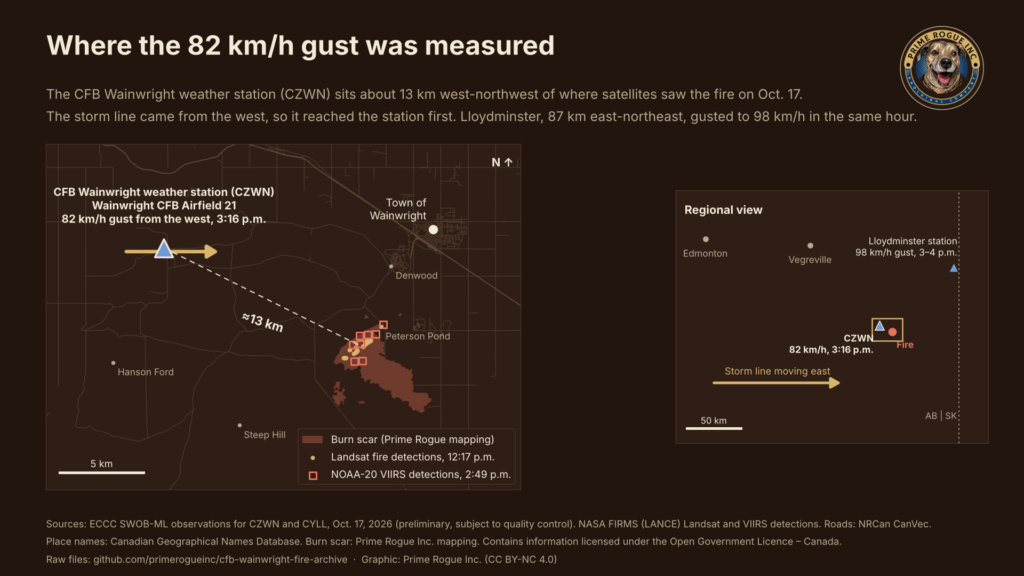
A reading is only as useful as its location. Each SWOB file gives the station’s coordinates: 52.8294° N, 111.0956° W. Measured against NASA’s satellite fire detections from Oct. 17, the station sits about 13 km west-northwest of the fire.
That matters in two ways:
The satellite view shows the same afternoon from above. This 30-second loop of NOAA’s GOES-18 images, from 2:30 to 4:30 p.m., marks the station and the fire as the cold front’s cloud moves in from the west. The satellite shows cloud, not wind, so the loop illustrates the front’s direction of travel; the 82 km/h figure comes from the station alone.
GOES-18 visible imagery, 2:30 to 4:30 p.m. MDT, Oct. 17. The satellite shows cloud, not wind. (Data: NOAA GOES-18, NOAA fire product, ECCC. Video: Prime Rogue Inc.)
You don’t need to trust us. You can verify that our archived file is identical to what we downloaded, and that it hasn’t changed since:
sha256sum or shasum -a 256). It should be 8a67ce72a9c8190f4551569002ca5ff66865bda2c10267739948cc42e500b54b.Found an error? Tell us through the archive page and we’ll correct it publicly.
 Step-by-Step Guide to Open JSON Files
 A week of satellite data on the CFB Wainwright fire: burning by 2:49 p.m., likely since morning
 CFB Wainwright Deaths: Alberta Says Its Medical Examiner’s Investigation is Separate from Military’s
 DND said the Wainwright fire “ignited” at 4 p.m. The military now says it was known for hours


