Address
304 North Cardinal St.
Dorchester Center, MA 02124
Work Hours
Monday to Friday: 7AM - 7PM
Weekend: 10AM - 5PM

Address
304 North Cardinal St.
Dorchester Center, MA 02124
Work Hours
Monday to Friday: 7AM - 7PM
Weekend: 10AM - 5PM
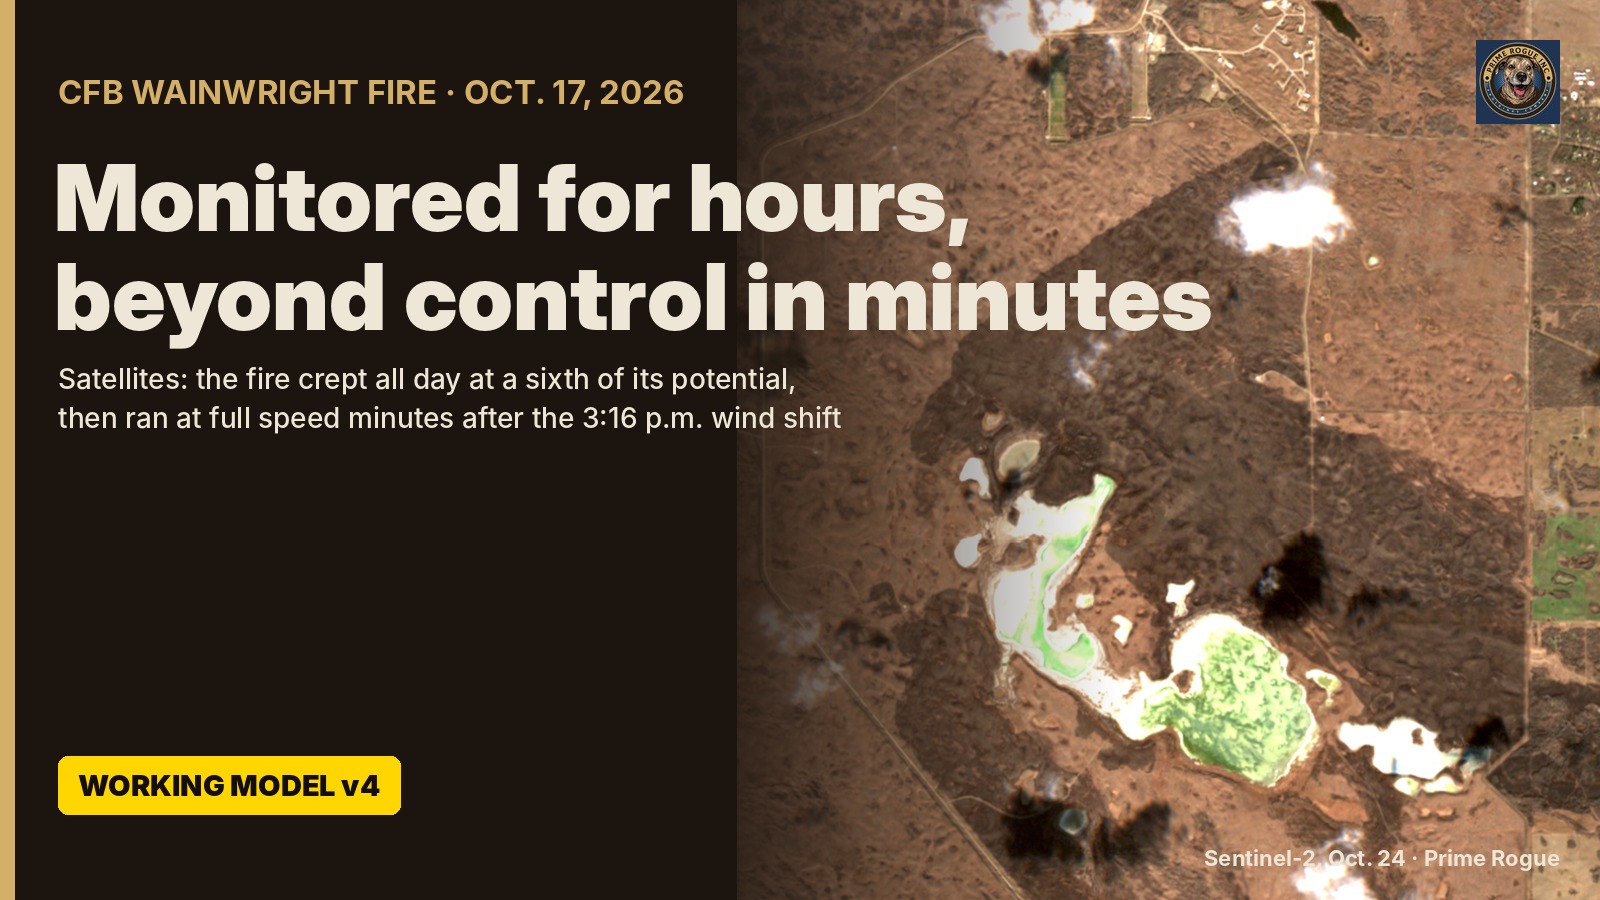
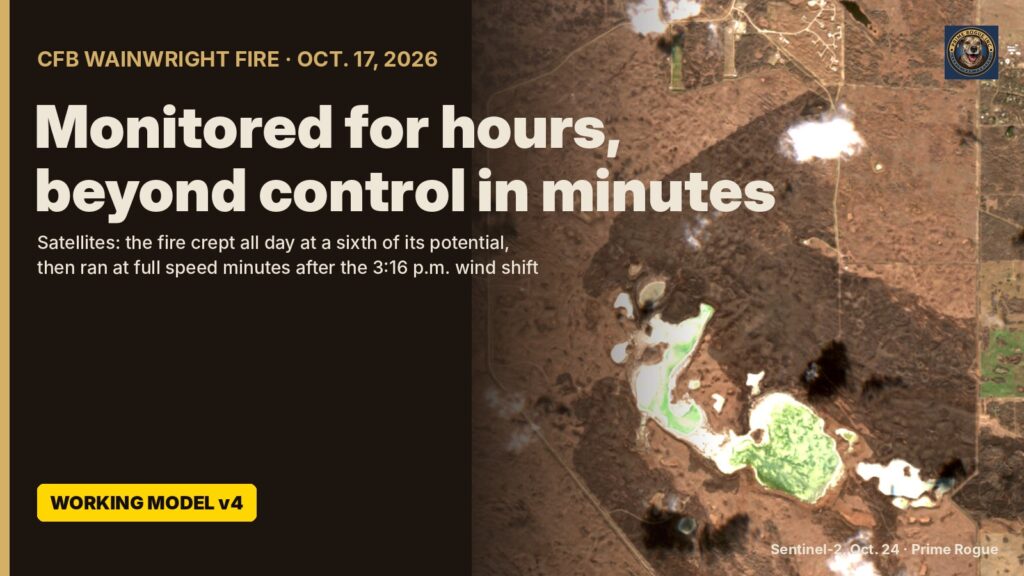
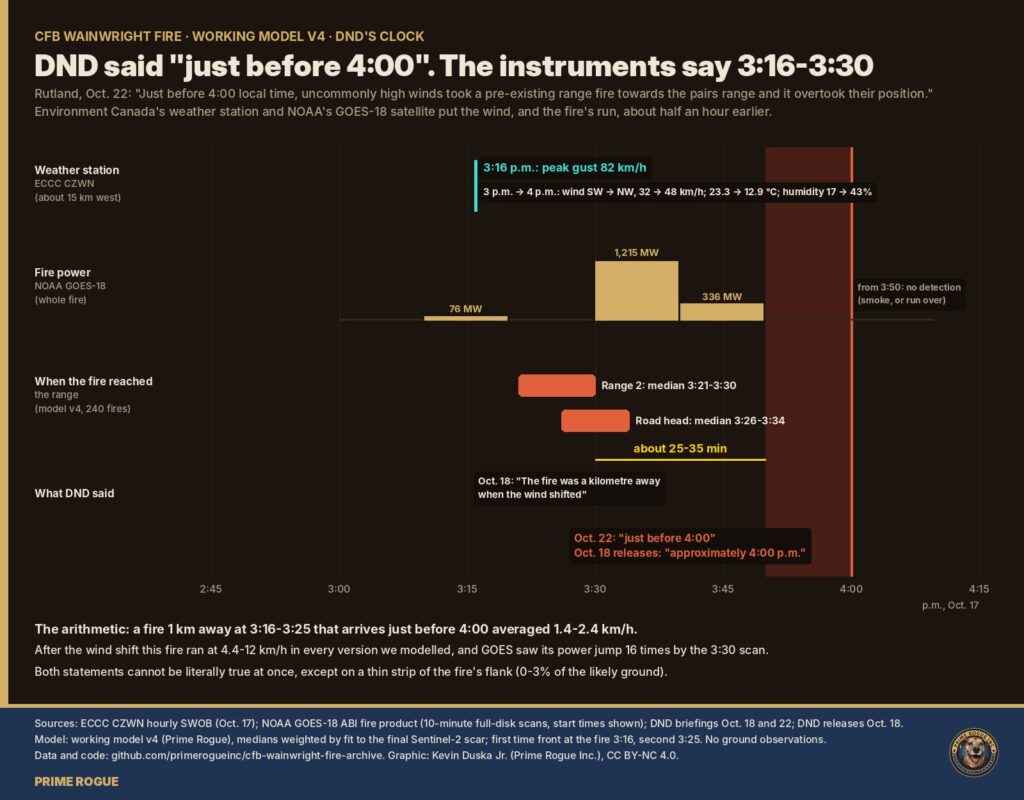
Environment Canada’s weather station at CFB Wainwright recorded the peak gust of the cold front that drove the Oct. 17 fire, 82 km/h, at 3:16 p.m. A U.S. weather satellite saw the fire’s power jump about sixteenfold by its 3:30 p.m. scan. On Oct. 22, Maj.-Gen. Wade Rutland, commander of 1st Canadian Division, put both the winds and the moment the fire overtook soldiers on a pairs range at just before 4:00 p.m.
Four days earlier, Rutland had said: “The fire was a kilometre away when the wind shifted. It is not normal for a fire to move a kilometre in 30 to 60 seconds.” (as quoted by Global News) The next day, Prime Minister Mark Carney told Parliament the fire “jumped nearly a kilometre in less than a minute to where soldiers were gathered” (AP via KPRC; PMO transcript).
Read together, DND’s statements describe a wind shift just before 4:00 and a fire that reached the range almost at once. The weather station puts the front’s arrival about 40 minutes earlier, and the satellite saw the fire in a full run by 3:30, 20 to 30 minutes before DND’s time. If they are right, either the soldiers were overtaken around 3:20 to 3:35 p.m., not just before 4:00, or they were still on the range half an hour after the wind turned the fire toward them. DND has not said which.
Neither record depends on Prime Rogue’s fire model; the model, in the second half of this piece, agrees with them.
This is working model v4 of Prime Rogue’s reconstruction of the fire. It is a working model, not a final finding. All data and code are public. Earlier versions: the flank that became the front, the C Company reconstruction and our live updates.
DND’s accounts have changed in one respect and held in another: the fire went from one that “ignited” during the afternoon’s training to one that had burned all day, but the time stayed at about 4:00.
| Date | Who | What was said |
| Oct. 18 | DND news release | A fire ignited within the training area of Canadian Forces Base (CFB) Wainwright, Alberta, at approximately 4:00 p.m. (local time) on October 17, 2026. |
| Oct. 18 | DND news release | Its account opens “at approximately 1600 hrs (MDT),” with the unit conducting live-fire training. The next point: “While conducting training a fire ignited and high wind speeds enabled the fire to grow and spread very rapidly overtaking the unit administrative area.” |
| Oct. 18 | Rutland, media briefing | “The fire was a kilometre away when the wind shifted. It is not normal for a fire to move a kilometre in 30 to 60 seconds.” |
| Oct. 22 | Brig.-Gen. Vanessa Hanrahan, Canadian Forces Provost Marshal, written statement | “The fire remained within Permanent Danger Area 2 of that range, which restricted firefighters’ ability to conduct direct suppression operations. It was therefore monitored throughout the day.” Reading it at the briefing, she said the fire “initially remained” within the danger area and was monitored “by both range control and the base fire hall.” |
| Oct. 22 | Rutland, media briefing | Just before 4:00 local time, “uncommonly high winds took a pre-existing range fire towards the pairs range and it overtook their position.” |
The Oct. 18 releases describe a fire that ignited during training, at about 4 p.m. By Oct. 22 it was a “pre-existing range fire” that had been monitored all day. Officials did not explain that discrepancy, StrathmoreNow reported. The Globe and Mail reported that internal military communications described the first fire as “smouldering” before it “blew over 1 kilometre”, and that a memo told officials the fire index “was low”. The national fire-danger system rated the area Extreme that afternoon.
Rutland opened the Oct. 22 briefing by correcting two things he had said on Oct. 18: the soldiers were setting up a pairs range, not a section attack range, and the board of inquiry would take longer than a month. “Getting the facts right matters,” he said. He did not correct the kilometre, and we found no correction published since.
Later in that briefing, a reporter asked whether the fire was being visually monitored between 3 and 4 p.m. “Unfortunately I do not have those details to be able to confirm,” an official answered. “What I can confirm is the fire was being monitored from the time that it originated on the AGL range to the time that the incident took place.” Asked by Prime Rogue whether the fire’s origin and the pairs range were separate places, an official said “those are two separate ranges,” and that the topography, “exact grid locations, and who could see what will come out in the investigation.” Prime He was then asked how long it was from the fire’s start to “around 4 p.m. when the wind had shifted,” in his words. The answer: those times “are all part of the ongoing investigation and it would be inappropriate for me to speculate on exact dates and times at this time.”
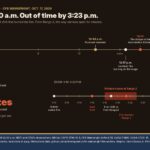
The front’s peak gust hit the station at 3:16 p.m., and the fire was in a full run by the satellite’s 3:30 p.m. scan. Both records are public. In this piece, “the wind shift” means the front’s arrival, timed by that gust.
Environment and Climate Change Canada, CFB Wainwright station (CZWN), at the airfield, roughly 15 km west of the burned area by our measurement:
| 3 p.m. reading | 4 p.m. reading | |
| Wind direction | South-west (236°) | North-west (307°) |
| Wind speed, 10-minute mean | 32 km/h | 48 km/h (2-minute mean 51 km/h) |
| Peak gust in the past hour | 51 km/h (2:48 p.m.) | 82 km/h (3:16 p.m.) |
| Temperature | 23.3 °C | 12.9 °C |
| Relative humidity | 17% | 43% |
That is a cold front: the wind swung about 70 degrees and the temperature fell more than 10 degrees within the hour, as Global News also reported from the same station. Environment Canada’s public hourly table gives the hour’s peak gust but not its time, as Global noted. The 3:16 p.m. time comes from the gust-time field in the station’s raw SWOB observation record, which we archived. That gust came from the west (269°); by the top of the hour the wind had settled in the north-west.
Environment Canada issued a wind warning for the Wainwright area at 2:14 p.m. (bulletin archived), about an hour before the peak gust. Because the station is west of the fire, the front may have reached the fire a few minutes after 3:16. We allow up to 3:25.
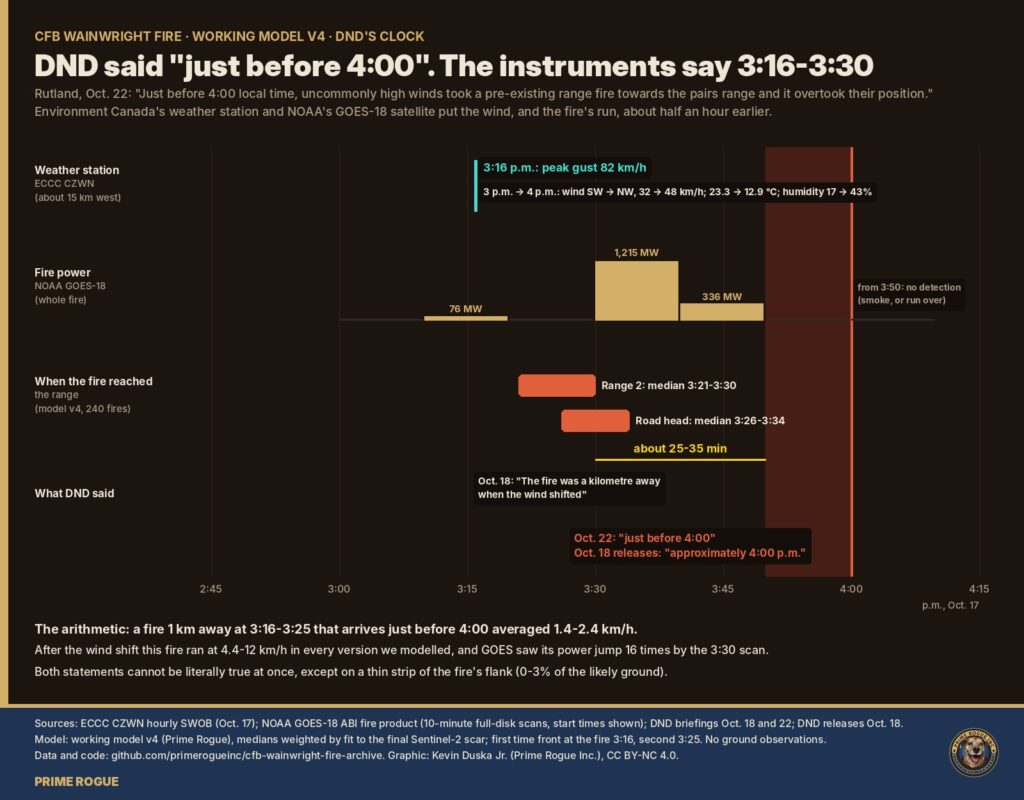
NOAA GOES-18 satellite, fire detection product, one full scan every 10 minutes:
| Scan start | Fire power |
| 3:00 p.m. | none detected |
| 3:10 p.m. | 76 MW |
| 3:20 p.m. | none detected |
| 3:30 p.m. | 1,215 MW |
| 3:40 p.m. | 336 MW |
| 3:50 p.m. onward | none detected |
GOES fire readings are coarse (pixels several kilometres across at this latitude) and patchy: the scans that detected the fire also flagged heavy cloud or smoke, and the second satellite, GOES-19, detected nothing all afternoon. So the 3:20 gap probably means a missed detection, not a pause. The jump of about 16 times between 3:10 and 3:30 is the fire’s run. From the 3:50 scan the satellite no longer detected it, whether because of smoke or because the run had passed.
At the speeds this fire ran after the wind shift, a kilometre took 5 to 14 minutes. Rutland’s 30 to 60 seconds would mean 60 to 120 km/h, several times faster than any grass fire we know of.
Every version of the fire we modelled ran at 4.4 to 12 km/h after the front. The standard Canadian grass-fire calculation for the 4 p.m. weather gives about 7 km/h. A 2013 case study of two Alberta grass fires by Alexander, Heathcott and Schwanke classes anything at or over 5 km/h as beyond control; its Lethbridge fire ran 8.3 km/h in winds averaging 69 km/h.
So, starting from the wind shift the instruments recorded:
| If the front reached the fire at | A kilometre at 4.4-12 km/h arrives | For “just before 4:00” (3:50-3:59), the fire must average |
| 3:16 p.m. (station time) | 3:21-3:30 p.m. | 1.4-1.8 km/h |
| 3:25 p.m. (latest we allow) | 3:30-3:39 p.m. | 1.8-2.4 km/h |
Those required speeds are what you would expect of a fire in moderate afternoon wind, not one driven by an 82 km/h front. They are also the opposite of a kilometre in 30 to 60 seconds.
DND’s timeline and the instruments can’t all be right, and each way of reconciling them leaves a question only DND can answer.
1. DND’s timeline is right, and the wind shifted just before 4:00. Then Environment Canada’s station is wrong by about 40 minutes, and NOAA’s satellite saw the fire in a full run before the wind had shifted at all. Nothing we have found supports that.
2. The wind shifted at 3:16, and “a kilometre away” is right. Then the fire reached the range in the 3:20s or early 3:30s on any realistic speed, or about 3:17 on Rutland’s 30 to 60 seconds. “Just before 4:00” would be late by 10 to 40 minutes, about half an hour on the model’s median times, in DND’s own account of when its soldiers were overtaken. What record is DND’s time based on?
3. The wind shifted at 3:16, and “just before 4:00” is right. Then 25 to 40 minutes passed between an 82 km/h wind shift toward the range and the fire’s arrival, and the fire could not have been a kilometre away moving at full speed. DND says range control and the base fire hall monitored the fire all day, “to the time that the incident took place.” What did they know about the wind and the fire after 3:16, and when was the unit on the pairs range told?
Our model and the satellite favour the second reading. Only DND’s records can confirm it.
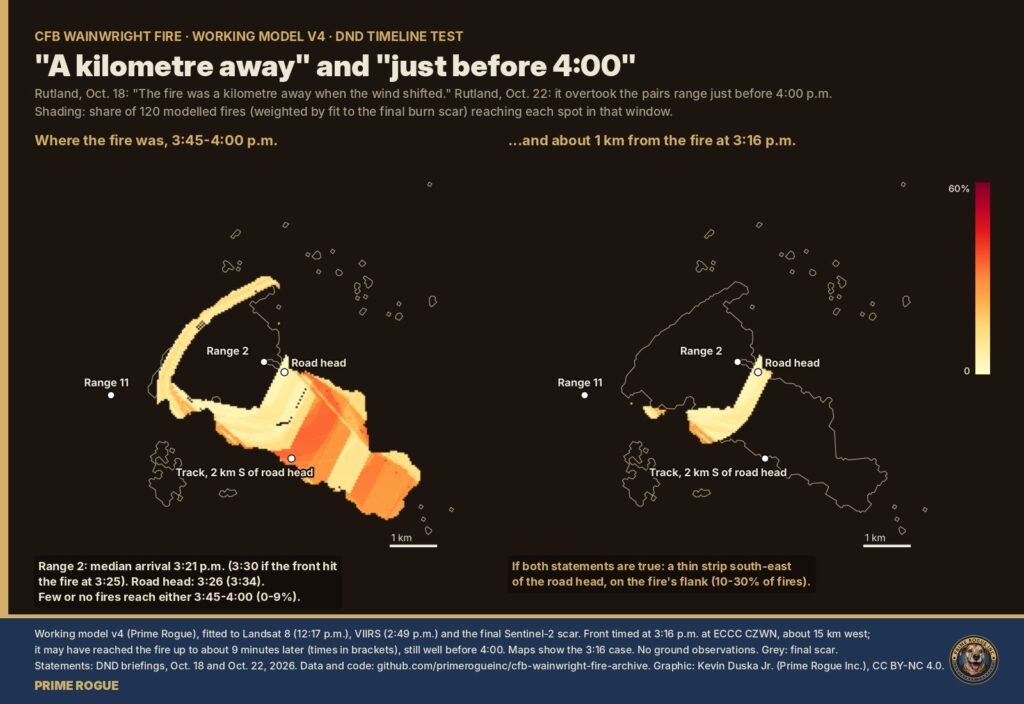
Working model v4 agrees with the instruments: the fire reaches the area where the pairs range most likely was in the 3:20s to mid-3:30s, and almost never just before 4:00.
The model rebuilds the fire from satellite detections at 12:17 p.m. (Landsat, the noon photograph and 2:49 p.m. (VIIRS), and the final burn scar. After the front it runs 240 versions, varying everything we varied in earlier parts: start time and shape, wind direction (five schedules), head speed (4.4, 8 and 12 km/h), gustiness, and the front reaching the fire at 3:16 or 3:25 p.m. Each version is weighted by how well it reproduces the final scar.
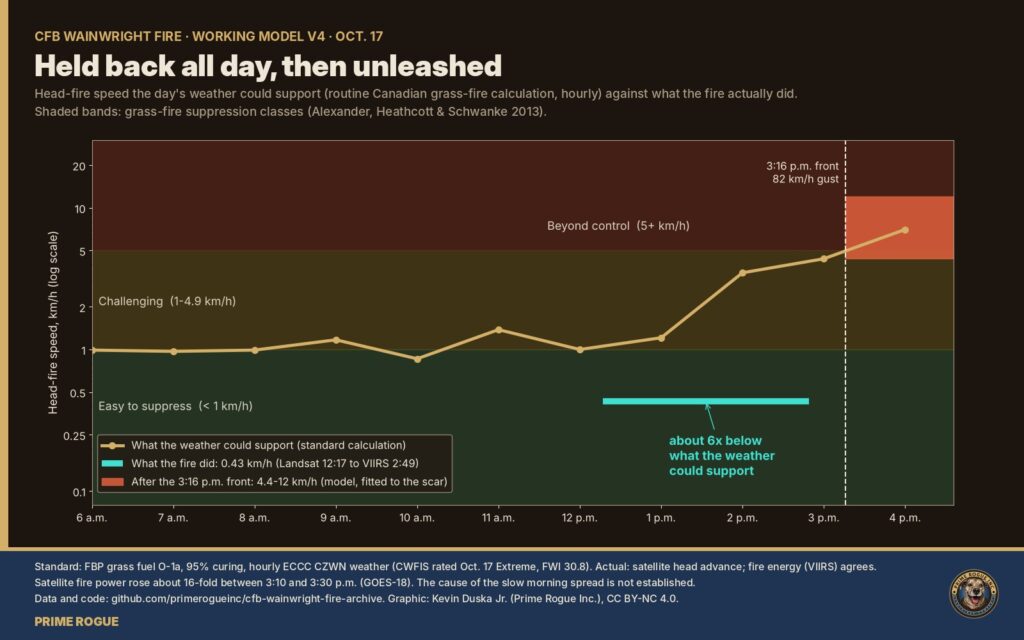
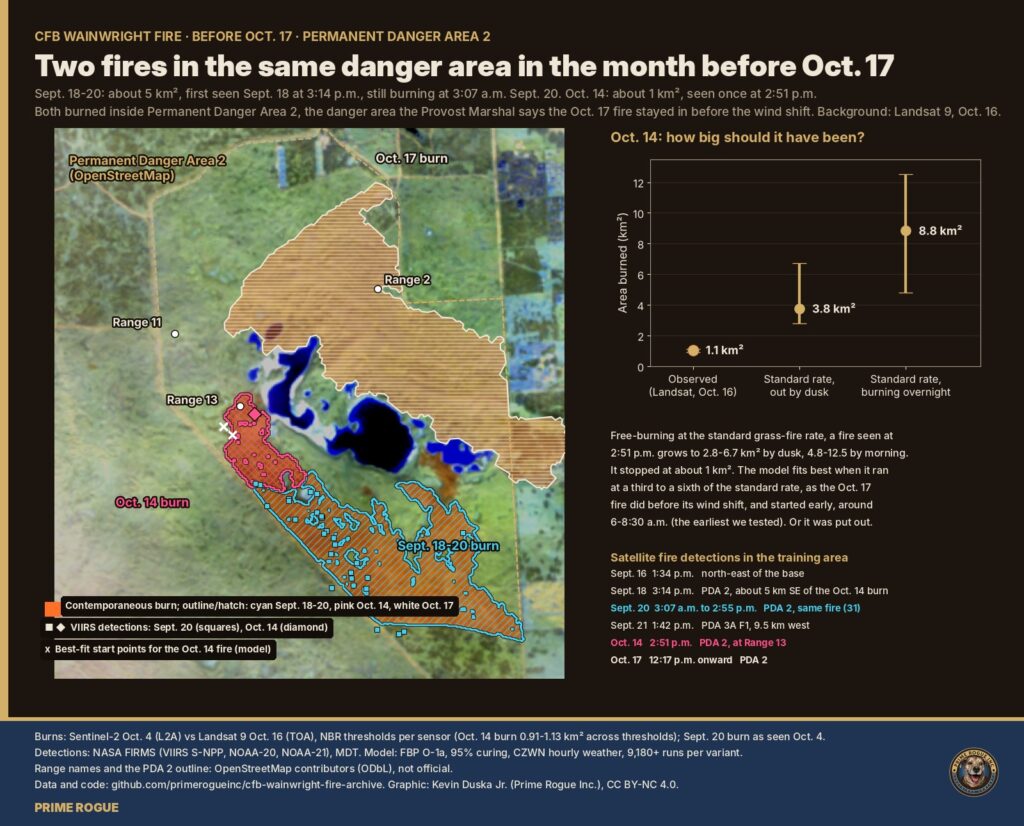
Between 12:17 and 2:49 p.m. the fire spread at about 0.43 km/h, roughly a sixth of what the standard calculation gives for that afternoon’s weather (about 2.5 km/h). Once the front arrived it ran at full speed.
| Front at the fire 3:16 p.m. | Front at the fire 3:25 p.m. | |
| Range 2, median arrival | 3:21 p.m. | 3:30 p.m. |
| Road head, median arrival | 3:26 p.m. | 3:34 p.m. |
| Likely ground burned by 3:30 p.m. | 84% | 35% |
| Likely ground burned by 3:45 p.m. | 98% | 93% |
| Likely ground first reached 3:45-4:00 p.m. | 2% | 6% |
DND has not said where the pairs range was. Range 2 and the road head are Prime Rogue’s inference, from the kilometre and the range layout (part 2 of our stress test), not an official location.
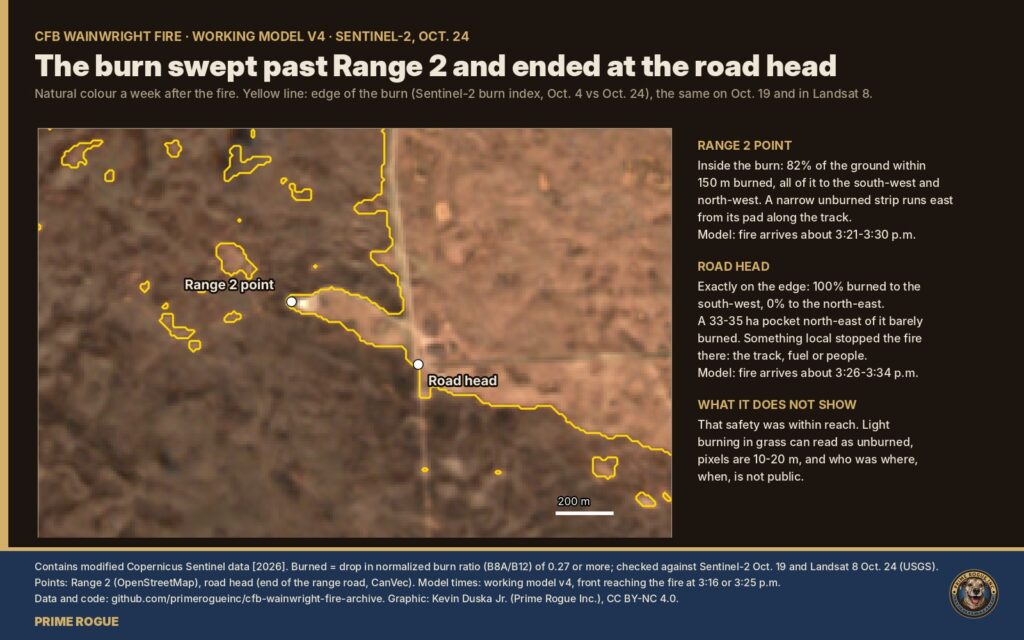
On three independent images from Oct. 19 and Oct. 24, the Range 2 point is inside the burn: 82-84% of the ground within 150 m burned, though the single 30 m pixel at the point reads unburned, on a strip along the track. The road head sits exactly on the scar’s edge, with an unburned pocket of 33-35 ha to its north-east that no modelled fire reproduces. Something local stopped the fire there: a track, the fuel, or people.
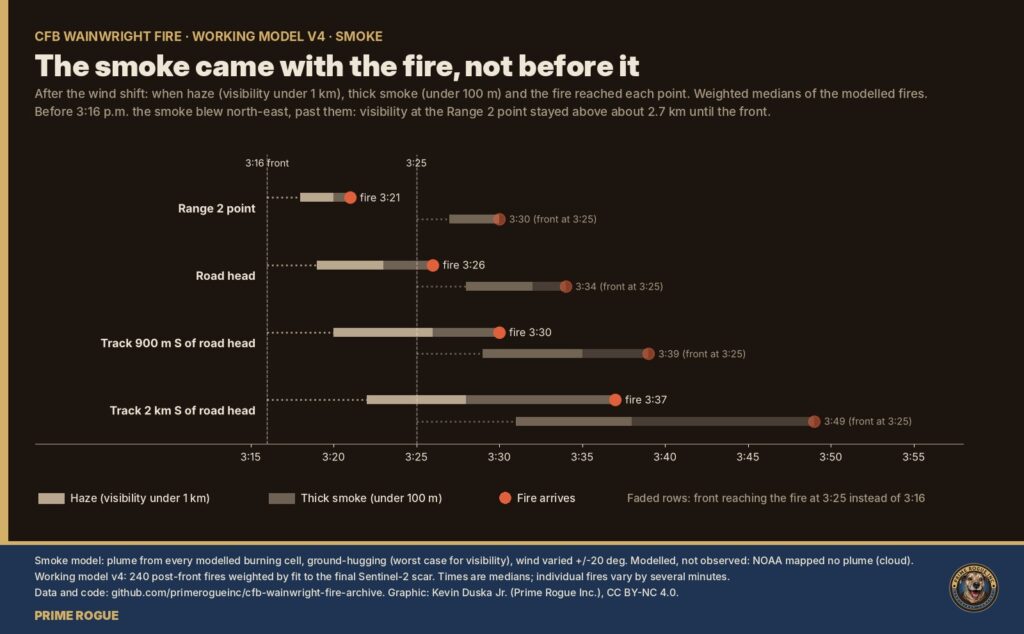
Before 3:16 the smoke blew north-east, away from the range. After the front, haze, dense smoke and fire arrived within minutes of each other: at Range 2, haze at 3:18, dense smoke at 3:20, fire at 3:21.
Across all 240 versions, minutes decide who gets out. From the Range 2 area, a soldier who left at the gust escaped in about three-quarters of modelled fires; three minutes later, under half; seven minutes later, about one in ten. However the versions are weighted, those odds stay within 68-81%, 36-48% and 2-14%.
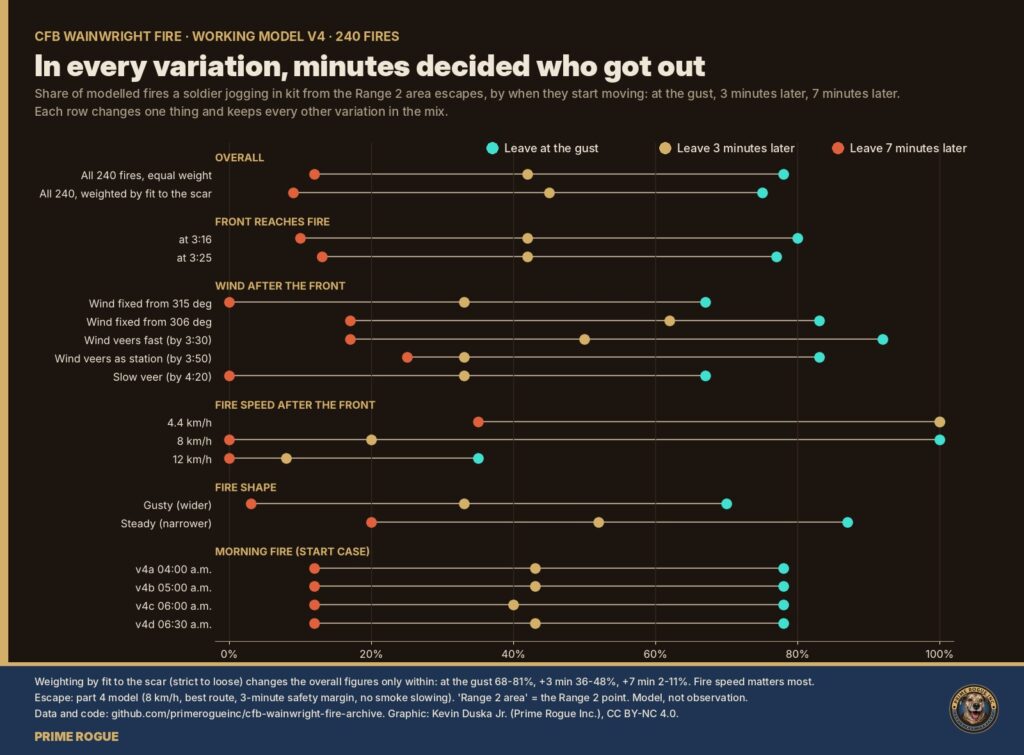
The whole model was run 10,000 times from scratch with near-identical results. It has no ground observations.
The explanation that matches DND’s timeline in full, a late wind shift, is the one the evidence contradicts most. The explanations that fit best each require one DND statement to be approximate or wrong.
We used analysis of competing hypotheses, a method from intelligence analysis (Richards J. Heuer Jr., Psychology of Intelligence Analysis, CIA Center for the Study of Intelligence, 1999, ch. 8). Every piece of evidence is rated against every explanation, from strongly consistent to strongly inconsistent, and weighted by how far we trust it (high 1.0, medium 0.7, low 0.4). Explanations are ranked by the weight of evidence against them, because evidence that fits several explanations proves little. A score of 0 means nothing contradicts it. The ratings are our judgements; each cites its source in the archive.

| Rank | Explanation | Evidence against | “A kilometre away” (Oct. 18) | “Just before 4:00” (Oct. 22) |
| 1 (tie) | Range 2 / road head area, overtaken about 3:20-3:35 | -1.1 | Holds | Off by about half an hour |
| 1 (tie) | Further south-east, 2-3 km from the fire at the shift, overtaken about 3:40-3:55 | -1.1 | Off: more like 2-3 km | Holds |
| 3 | On the fire’s flank, a strip south-east of the road head | -1.4 | Holds | Holds |
| 4 | The wind shift reached the fire about half an hour after the station, as DND’s wording implies | -4.1 | Holds | Holds |
Timing evidence cannot separate the top two; where the pairs range was would, and DND knows. The flank explanation is only narrowly behind on score, but it needs the range on 0-3% of the likely ground. The late wind shift is contradicted by both the weather station and the satellite.
The slow afternoon is the backdrop to “monitored throughout the day.” The standard calculation said about 2.5 km/h; the fire did about 0.43, on a day the national fire-danger system rated Extreme near the base.
| Rank | Explanation | Evidence against | Fits DND’s account? |
| 1 | Fine-scale fuel below 10 m: grazing, trampling, cratering, short grass | 0.0 | Not addressed |
| 2 | Indirect containment: guards or roads at the boundary of permanent danger area 2 | -0.7 | Fits “remained within Permanent Danger Area 2” |
| 3 | Damper fuel and lighter wind at grass height than the station shows | -1.7 | Not addressed |
| 4 | Direct firefighting held it | -2.1 | No: the Provost Marshal says direct suppression was restricted |
| 5 | Patchy ground at 10 m or larger (bare ground, old burns) | -3.0 | Not addressed |
| 6 | Grass still partly green | -3.1 | Not addressed |
| 7 | Not really slow: a measurement error | -3.4 | Not addressed |
A caution on rank 1: our imagery cannot see features under 10 m, so nothing can contradict it, and it scores best partly for that reason. DND could rule it in or out by saying whether the area was grazed. Whatever held the fire back, it stopped holding once the front arrived.
Oct. 17 was not the first fire in the training area this fall. Satellites detected five between Aug. 27 and Oct. 17, all but one inside the permanent danger areas, and all but one short burst in the danger areas burned far slower and smaller than the standard grass-fire calculation, as Oct. 17’s fire did before its wind shift.
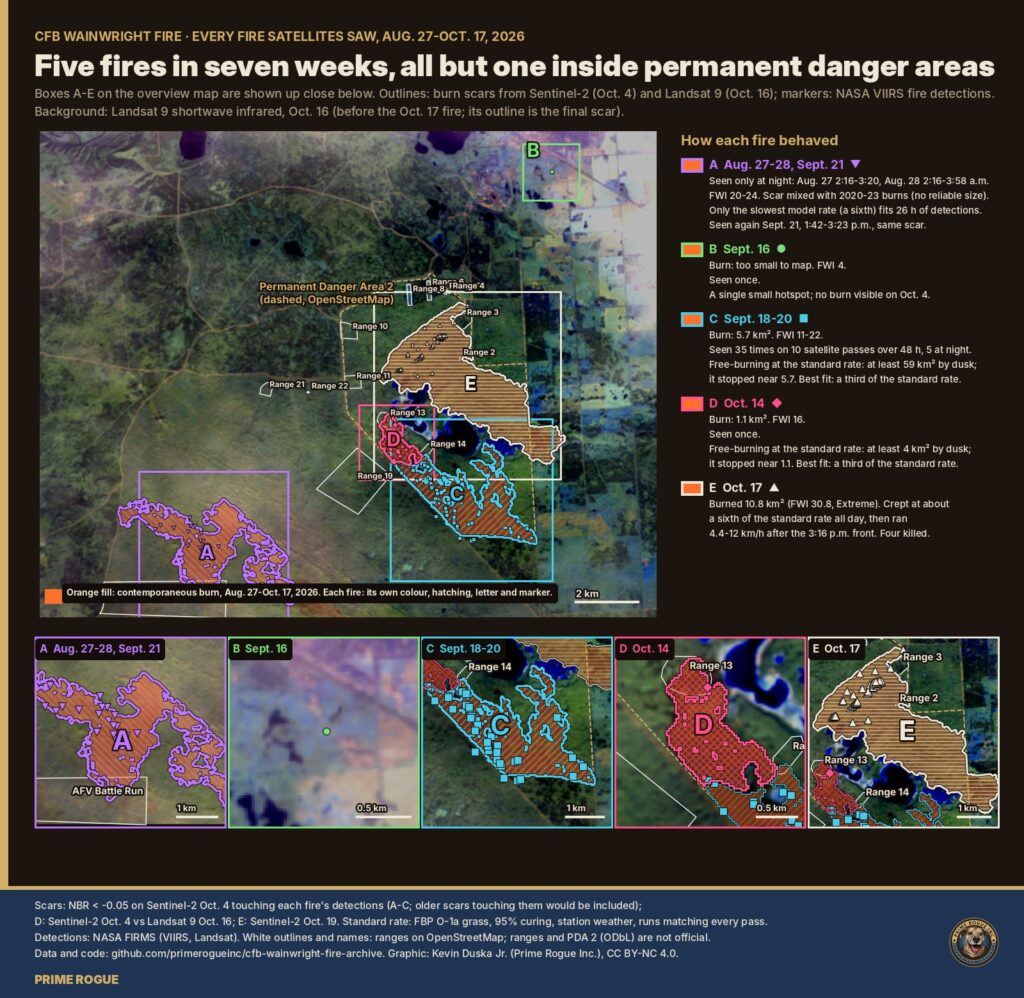
| Dates | Where (OpenStreetMap, not official) | Satellite detections | Burned | Fire danger | Against the standard calculation | |
| A | Aug. 27-28; again Sept. 21 | Permanent Danger Area 3A, AFV battle run | 12 over two nights, all between 2 and 4 a.m.; 7 more on Sept. 21 | Mixed with 2020-2023 burns; no reliable size | Very high | Aug. 27-28: would have filled the 61 km² modelled area; only a sixth of the standard rate fits. The Sept. 21 burst fit the standard rate |
| B | Sept. 16 | Outside the mapped danger areas | 1 (1.1 MW) | Too small to map | Low | – |
| C | Sept. 18-20 | Permanent Danger Area 2, reaching Range 14 | 35 on 10 satellite passes over 48 hours, 5 at night | 5.7 km² | Moderate to very high | At least 59 km² at the standard rate; fits at about 0.3 of it |
| D | Oct. 14 | Permanent Danger Area 2, Range 13 | 1 (2:51 p.m.) | 1.06 km² | High | About 4 km² by dusk at the standard rate; fits at about 0.3 |
| E | Oct. 17 | Permanent Danger Area 2, Range 2 area | Landsat 12:17, VIIRS 2:49, GOES 3:10-3:40 p.m. | 10.8 km² | Extreme | About a sixth of the standard rate before 3:16 p.m. |
Two things follow. First, it supports the leading explanation for the slow afternoon: this ground burns slower than the standard model, for reasons satellites cannot see. Second, if range staff watched those fires, they would have seen fires in the danger areas stay tame several times this fall, including ones that burned through the night. What the satellites cannot show is whether any of them was fought or allowed to burn. We found no news coverage or DND statement about the August or September fires.
DND burns parts of the base on purpose in spring and announces those fuel-reduction burns: Apr. 10 to May 5 this year, according to Lakeland Connect, and Apr. 2 to May 2 in 2024, according to the Town of Wainwright. We found no public notice of burns in late summer or fall 2026. For the longer record, see the 2025 fire season on the base and controlled burns near CFB Wainwright.
A single timestamp would settle this: when the first emergency call or radio report came from the pairs range.
| Likely response | Why it doesn’t close the gap |
| “Just before 4:00” was approximate. | The gap is about half an hour on the model’s median times, and at least 10 minutes on any speed we modelled: not rounding. If the time was approximate, DND can give the exact one. |
| The wind shifted later at the range than at the station. | We already allow the front to reach the fire up to 3:25. The satellite independently shows the fire’s power up about 16 times by the 3:30 scan. |
| “A kilometre” was approximate. | Then the range was further away, closer to 2-3 km, and “just before 4:00” can hold. DND can say where the range was. |
| The fire needed time to build after the shift. | That contradicts Rutland’s own “30 to 60 seconds,” and the satellite saw a full run by the 3:30 scan, about 15 minutes after the gust. |
| Prime Rogue’s model is not ground truth. | Agreed. The core finding does not rest on it: the station, the satellite and DND’s own words are enough. |
Records DND holds that would settle the timeline:
Prime Rogue sent DND these questions on October 25, 2026. DND had not replied by the time of publication. We have also requested the records under the Access to Information Act and will publish them in full.
All graphics are by Kevin Duska Jr. (Prime Rogue Inc.), CC BY-NC 4.0, and are in the archive at full resolution.
 Satellites saw fire on CFB Wainwright range hours before DND says it ignited
 DND said the Wainwright fire “ignited” at 4 p.m. The military now says it was known for hours
 What Happened to C Company: How a Forecast Wind Shift Trapped Soldiers at CFB Wainwright
 Another sign pointing away from gas: what satellites and the regulator show about CFB Wainwright’s gas lines


[…] official said the Act applies to all deaths in Alberta, including those on Canadian Armed Forces bases, because federal and provincial legislation currently allow it. The official also noted that […]
[…] said that after the 3:16 p.m. cold front, “the wind blew from 306°.” In fact, the base’s weather station recorded the front’s strongest gust, 82 km/h, from the west (269°) at 3:16 p.m. The wind turned […]
[…] By 3:10 p.m. its leading edge had reached the training area. At 3:16 p.m., the base’s weather station recorded a gust of 82 km/h. By 3:30 p.m., a fire on the range was hot enough to show up from 36,000 […]
[…] detections covered an area about 2.8 by 1 km, centred about 0.3 km further northeast. The base weather station recorded winds from the south-southwest to southwest all afternoon. A grass fire pushed by a steady […]
[…] Defence Research and Development Canada reports (2010-2020 average). Afghanistan casualties from Department of National Defence official records (158 deaths over 12 years, average deployment 2,500 […]
[…] – happens twice annually: spring (April/May) and fall (September/October). According to Department of National Defence documentation, these are intensive three-week operations with multiple aircraft making continuous […]
[…] signals intelligence and cybersecurity agency, likewise uses s.16(2) frequently. Being under the Department of National Defence, CSE often handles highly classified programs (e.g. foreign intelligence gathering, monitoring of […]
[…] 15: Carney confirmed the F-35 review had officially begun. The Department of National Defence admitted the scope was still being finalized, but that “alternatives” were on the […]