Address
304 North Cardinal St.
Dorchester Center, MA 02124
Work Hours
Monday to Friday: 7AM - 7PM
Weekend: 10AM - 5PM

Address
304 North Cardinal St.
Dorchester Center, MA 02124
Work Hours
Monday to Friday: 7AM - 7PM
Weekend: 10AM - 5PM
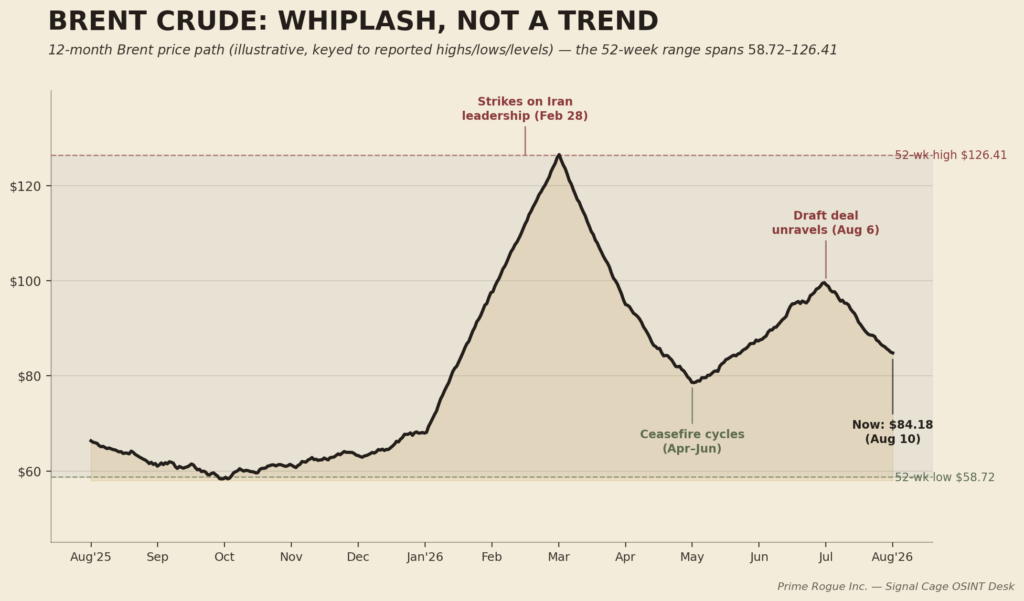
Brent crude has traded across a $58.72-to-$126.41 range over the past twelve months. That is not the signature of one shock working its way through the system. It is the signature of a cycle — a repeating structure of escalation, negotiation, and collapse that has now run at least five full loops since April 2026. Markets keep covering each turn as a discrete, surprising event. It isn’t discrete, and by this point it shouldn’t be surprising. Once you see the structure, you can locate where you currently sit inside it. That is the only kind of “geopolitical alpha” this series intends to deal in — not calls, not predictions dressed up as certainty, but a disciplined read of a pattern most coverage is missing because it’s reporting the news cycle instead of the actual cycle.
This is the first post in a new Prime Rogue vertical applying the same open-source intelligence standard we use for OSINT and accountability reporting to markets. Before you weigh anything in this piece, read the methodology note near the bottom — it explains what this series will and will not do, and it’s the most important paragraph on the page.
Strip away the daily headline churn and the last four-plus months break into five clean iterations of the same loop: escalate, threaten, mediate, partially agree, collapse. Repeat.
Five iterations, averaging three to five weeks each, and the theater has now widened once — from the strait itself to Saudi refining infrastructure at Jazan. That’s the trend line that actually matters more than any single headline: not whether this week’s talks succeed, but whether the geographic footprint of the conflict is expanding.
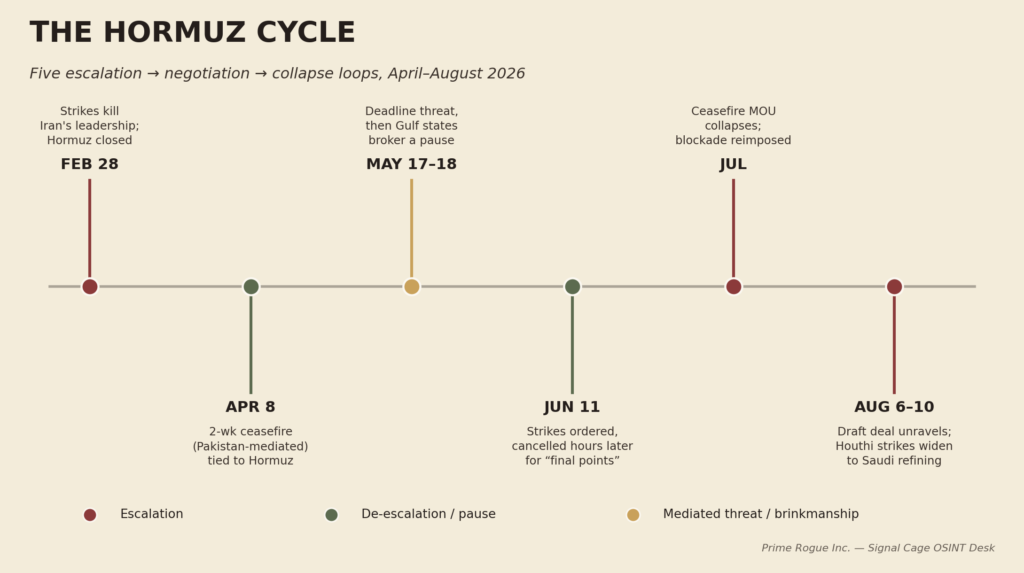
Each loop follows a near-identical sequence: rhetorical escalation or a deadline threat, a military or blockade action, mediated negotiation (Pakistan, Oman, or the Gulf states acting as circuit-breakers), a partial or technical agreement, and then collapse over a demand neither side has actually moved on. Iran’s core asks have not changed since April: end the U.S. naval blockade, lift sanctions, and secure compensation for war damage. Washington’s core ask — unconditional, full reopening of the strait — hasn’t moved either. Iran’s own negotiators have said explicitly that the current Oman talks are about vessel routing, not reopening the strait itself, and that broader resolution is contingent on the blockade lifting and a ceasefire being formally declared.
Because neither side’s underlying position has shifted in four months, there is no structural reason to expect the cycle to resolve on any particular date. Treating each round as a discrete “will they reach a deal” binary — which is how most market coverage frames it — misses the pattern. The better question isn’t whether a deal happens this week. It’s which stage of the loop you’re currently reading, and what would actually break the cycle rather than just pause it.
As of August 10, 2026: Brent is trading near $84.18/bbl, WTI near $78, and the Dollar Index sits around 99.6. The VIX — Wall Street’s volatility gauge — is at roughly 14.9, historically calm territory, and the S&P 500 just closed at a record high after its strongest week since April. Gold, meanwhile, is up roughly 6% year-to-date, with gold-backed ETFs up around 70% on a trailing one-year basis — a safe-haven bid, but a measured one, not a panic move.
That’s the actual finding here, and it’s more useful than any directional call: oil is whipsawing by double digits week to week — Brent alone posted a swing from a 52-week high near $126 down to $59 and back above $100 twice — while equities and currency markets have stayed comparatively calm throughout. FX volatility has remained largely contained despite the disruptions, and 2025–2026 has repeatedly shown a pattern of intense, alarming headlines coexisting with steady broad-market behavior.
One reasonable read: markets are pricing the cycle itself, not each individual shock. If participants now expect any given escalation or de-escalation to be temporary — because it has been, five times running — then neither leg of the cycle gets a full, durable repricing in risk assets, even though oil, the most direct transmission point, reprices hard every single time. That’s a testable hypothesis, not a certainty, and it’s exactly the kind of question this series will keep tracking rather than declare settled on day one.
A framework is only useful if it’s falsifiable. Here’s what would confirm the base case versus what would tell you the cycle is genuinely breaking — in either direction.
Volatility in oil and gas affecting everything downstream” is true, but it’s not a single hop — it’s an eight-link chain, and each link has its own lag. Mapping it explicitly is what separates a structural read from a vague directional mood.
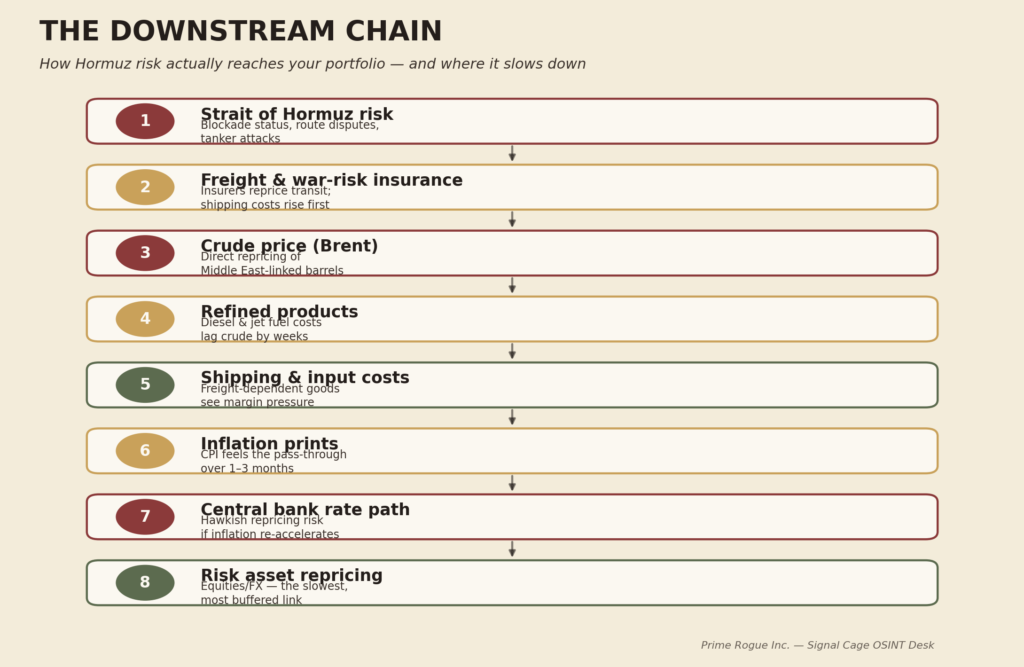
Worth noting: a barrel near $84 works out to roughly $2 of raw crude cost per gallon before refining, taxes, and distribution are layered on top. That margin-stacking is part of why equities can stay calm in a week when crude is repricing violently — the transmission lag itself acts as a buffer, at least until the chain compresses under repeated shocks.
As of this writing, we’re in the immediate aftermath of a collapsed draft framework: Iran’s restrictive Aug 6 proposal unwound the brief Oman-route optimism, Tehran is rejecting direct talks with Washington while Houthi attacks have widened to Saudi refining infrastructure at Jazan, and Iran’s own negotiator is publicly framing U.S. diplomacy as theater. That’s an expansion of the conflict’s footprint, not a new cycle in itself — but it’s the kind of input that shortens the runway to the next escalation leg, and it’s exactly what this series will be tracking over the next two to three weeks.
This series will not publish trade calls, price targets, or buy/sell signals. It applies the same sourcing discipline we use in ATIP and accountability reporting to markets: primary reporting and named sourcing over aggregation, explicit falsifiable markers over vague directional mood, and a willingness to say “the pattern hasn’t resolved yet” instead of manufacturing false certainty. We’re launching thematic, tied to developments as they warrant a fresh read, and will move to a weekly cadence once the tracking framework has enough cycle data to compound — with the same disclaimer attached to every post.
Because the Iran-Hormuz conflict has run through roughly five escalation-negotiation-collapse cycles since February 2026, and Brent reprices sharply at nearly every turn — even though the underlying political demands on both sides haven’t materially changed.
Not fully. Traffic moves under a contested, multi-route framework — Iran’s own designated route, a proposed Oman-IMO route, and a U.S. naval blockade that redirects, boards, or disables vessels attempting other paths. “Closed” and “open” both oversimplify a waterway currently governed by competing, unstable rules.
Unclear, leaning towards no in the short to medium term, and we’d flag anyone claiming certainty either way. Both sides’ core demands have been stable since April, which is exactly why the cycle has repeated rather than resolved. Israeli interference/sabotage of the process is also a critical variable driving the conflict’s cyclical escalation.
Through an eight-step chain: freight and war-risk insurance, crude pricing, refined products, downstream shipping and input costs, inflation prints, central bank rate expectations, and finally, with the longest lag, broad risk-asset repricing.
That’s not a question this series answers. This is intelligence analysis, not investment advice — see the disclaimer below, and do your own research or consult a licensed advisor before acting on anything here.
This is intelligence analysis, not financial advice. Nothing in this piece is a recommendation to buy, sell, or hold any security, commodity, or currency. Prime Rogue applies open-source intelligence methodology to markets; we are not licensed investment or financial advisors, and this content should be treated as one input into your own research, not a substitute for it. Do your own diligence and consult a qualified, licensed advisor before acting on anything published here.
 The Hormuz Cycle, Cycle Six: A Seizure, a Near-Deal, and the Toll Authority Nobody Recognizes
 The Hormuz Cycle, Cycle Seven: Strikes, Blockade Attrition, and the Seven-Day Plan Trump Rejected
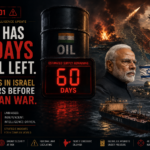 SITREP 001: India Has 60 Days of Oil Left. Modi Was in Israel 48 Hours Before the Iran War.
 Canada’s Diesel Blind Spot: How the Irving Oil Shutdown, a Dead Pipeline Deal, and a Global Refining Crisis Collided



[…] disruption is not resolved by mid-June — five weeks from the date of this writing — the global oil market will not normalize until 2027. The market has already lost more than one billion barrels of supply. […]
[…] But do we do this? Of course not. Instead, we let the Americans treat us like just another supplier, instead of recognizing that we have the kind of market control that OPEC has with oil. […]
[…] dirty secret of AI alignment is that it isn’t a solution. It’s a convenient fiction, a marketing strategy that allows corporations to keep deploying increasingly uncontrollable AI while maintaining plausible deniability. When alignment […]
[…] a country like Iraq, “you heard me, I would take the oil… I would not leave Iraq and let Iran take the oil.” During the 2016 campaign and into his presidency, he repeatedly floated the idea […]
[…] Sea, Eastern Europe) to force the U.S. to keep an eye on other theaters. In essence, a U.S.-Iran war could open opportunistic fronts for these powers, even if they stay out of the direct […]
[…] on purpose—but the U.S. still doubled down on Iraq as a regional partner. Because geopolitics is war crimes dressed in oil […]
[…] energy prices hurt the European economy, which is already struggling post-COVID and amid the war in […]
[…] the baseline from which the subsequent fractures — the Epstein files, the Kirk assassination, the Iran war, the Tucker-Trump break — can be properly […]
[…] Trade agreements prioritized banana exports while keeping local economies dependent on Western markets. […]
[…] August 10 read of the Hormuz Cycle identified five completed loops of escalation, mediation, and collapse since the war began on […]
[…] engage something, it means Iran expanded the theater. Another sign is panic or shifts in the oil market: the Gulf economies will try to maintain normal oil exports, but even rumors of conflict spreading […]
[…] Top U.S. allies rejected Trump’s demand to send warships to help reopen it on Monday. Energy prices are elevated. Recession risk is real and […]
[…] ascribed to the other side, which in turn justifies preemptive acts that victimize the other, keeping the cycle alive. Psychologically, Ethiopia’s fractures are self-perpetuating; without a concerted effort to […]
[…] to say: never saying what you actually think while everyone watches your hands for signals. But the Iran war is not a monetary policy statement. There are no forward guidance […]