Address
304 North Cardinal St.
Dorchester Center, MA 02124
Work Hours
Monday to Friday: 7AM - 7PM
Weekend: 10AM - 5PM

Address
304 North Cardinal St.
Dorchester Center, MA 02124
Work Hours
Monday to Friday: 7AM - 7PM
Weekend: 10AM - 5PM
At 2:50 p.m. on Oct. 17, a line of storm clouds sat just west of Canadian Forces Base Wainwright. By 3:10 p.m. its leading edge had reached the training area. At 3:16 p.m., the base’s weather station recorded a gust of 82 km/h. By 3:30 p.m., a fire on the range was hot enough to show up from 36,000 km away.
All of it was recorded by NOAA’s GOES-18 weather satellite, which photographs North America every 10 minutes, and all of it is public. Four soldiers died in the fire that followed. A CAF memo reported by Global News described the wind change as “unexpected and sudden.”
Prime Rogue has now put every satellite record of the fire on a single map, in the order it happened. Each layer was made independently, by a different satellite, agency or sensor. They tell one story.
National Defence’s news release says a fire “ignited” at approximately 4 p.m. As of 10:00 AM MT Monday, it had not been corrected.
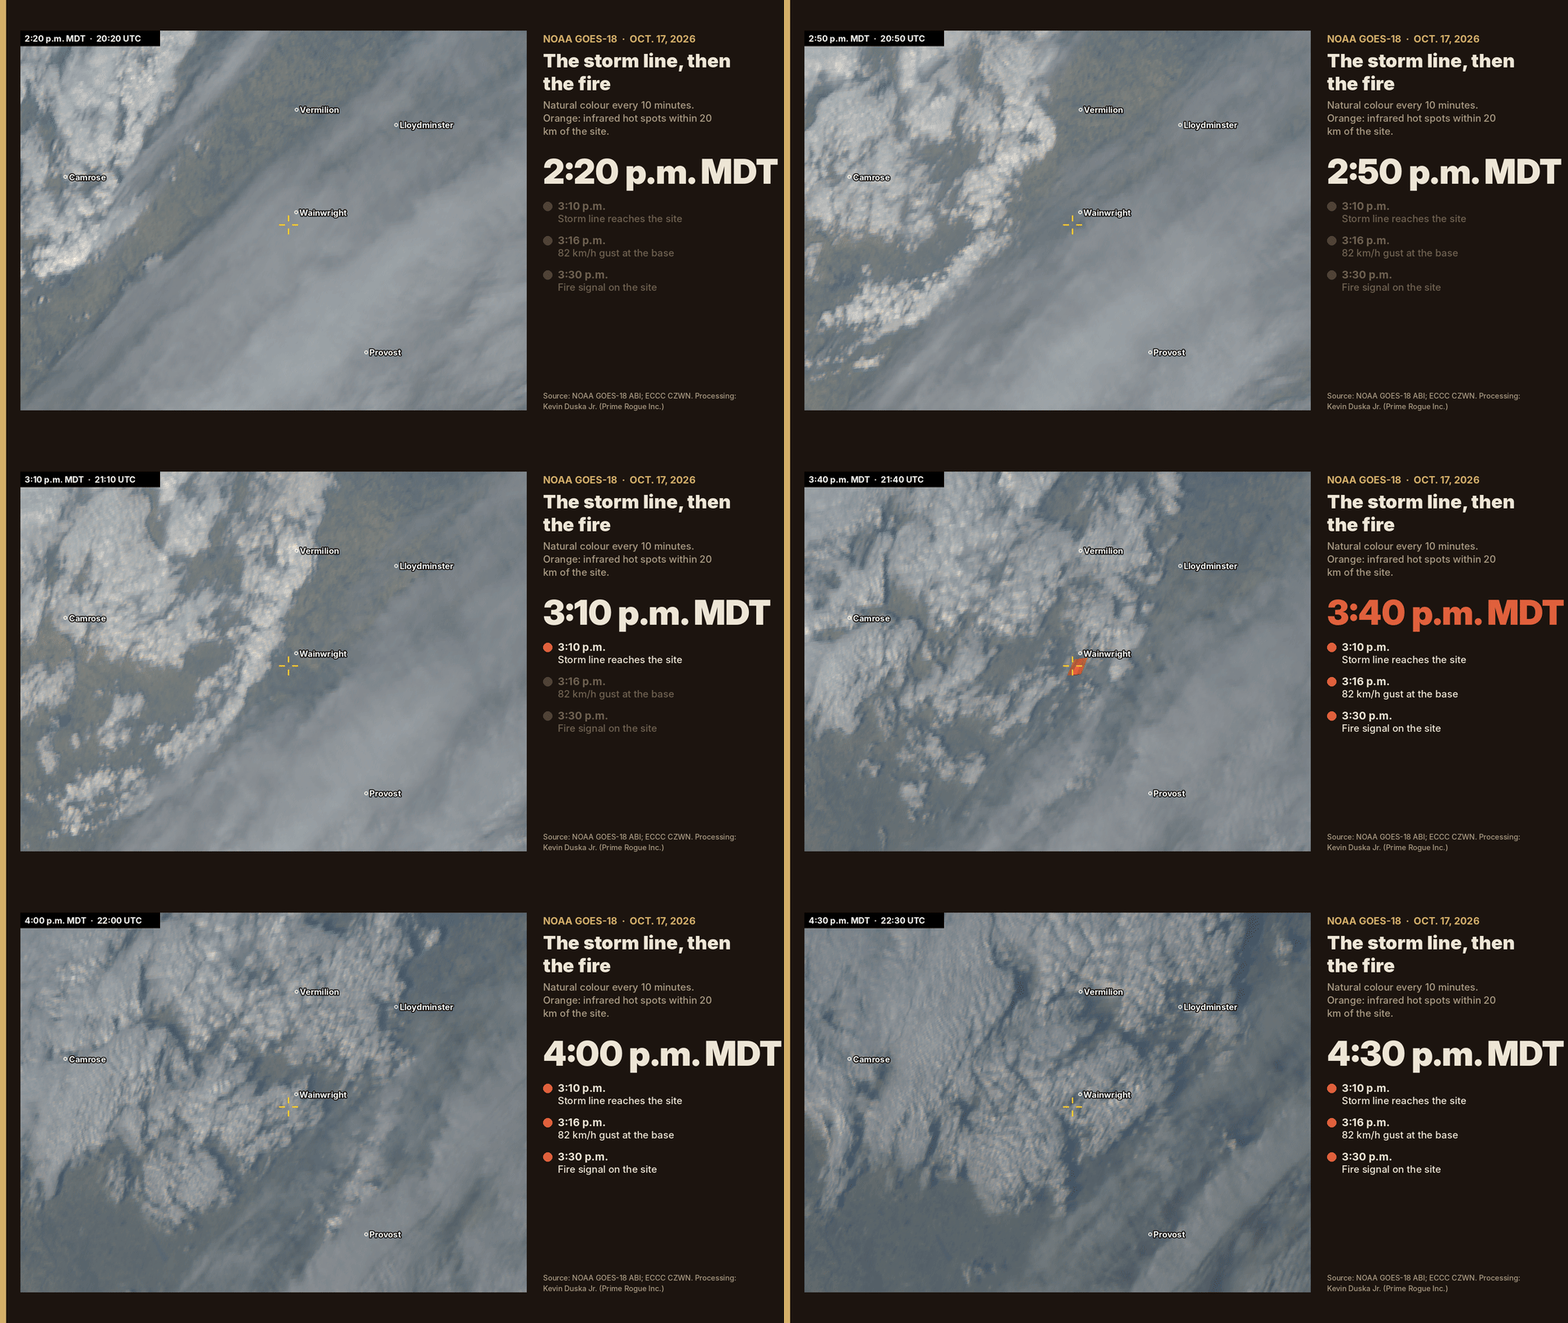
The six panels above cover about 290 by 210 km around the base. The bright, lumpy band is the storm line: the “line of showers and weak thunderstorms” that Environment Canada warned at 2:14 p.m. was moving east, with gusts up to 100 km/h.
You can watch it come. At 2:50 p.m. it is west of the base. At 3:10 p.m. it is over the training area. Six minutes later the base station logs its strongest gust of the day. At 3:30 p.m., an orange signal appears where the fire was burning.
Weather observer Ryan Purciel spotted this first. On Oct. 18 he posted a GOES loop noting that the incident appeared to happen, or intensify, just after a strong outflow boundary crossed the area. An outflow boundary is the gust front a line of storms pushes ahead of itself. Our processing of the raw data agrees with his reading.
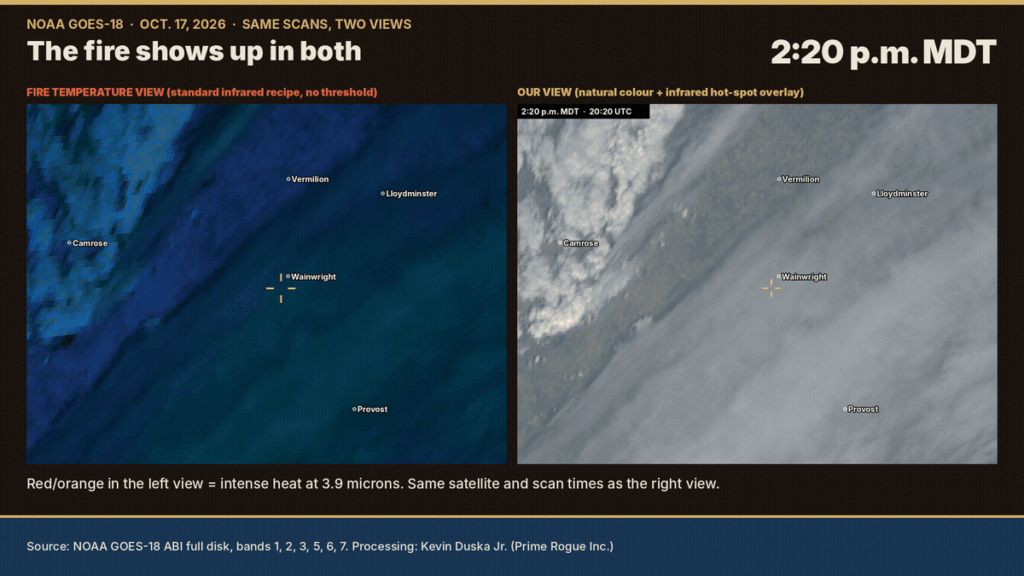
Satellite heat signals can be argued over, so we drew the scans two ways. On the right is our view: natural colour, with orange marking pixels at least 10°C hotter than their surroundings in the infrared. On the left is the standard “fire temperature” colouring used by forecasters, which applies no threshold at all. In that view, intense heat simply shows up red.
Neither shows a clear signal on the site through 3:20 p.m. Both show the fire at 3:30 and 3:40 p.m. The left view looks blue because that is how the recipe draws cloud and land.
The absence of a signal before 3:30 does not mean there was no fire. GOES pixels are 2 to 5 km wide at this latitude. A small grass fire does not register until it grows. Landsat, with 30 m pixels, saw it at 12:17.
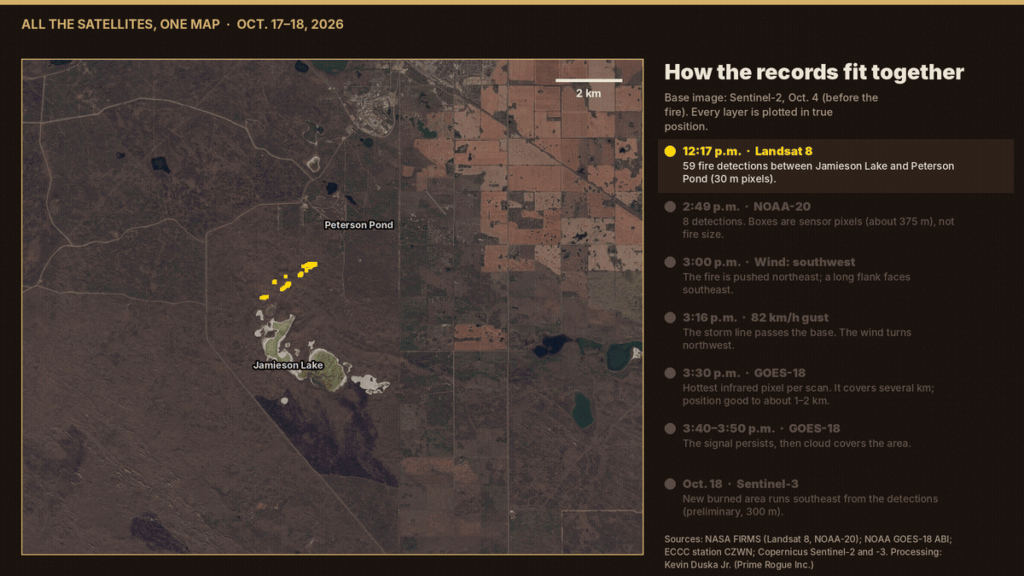
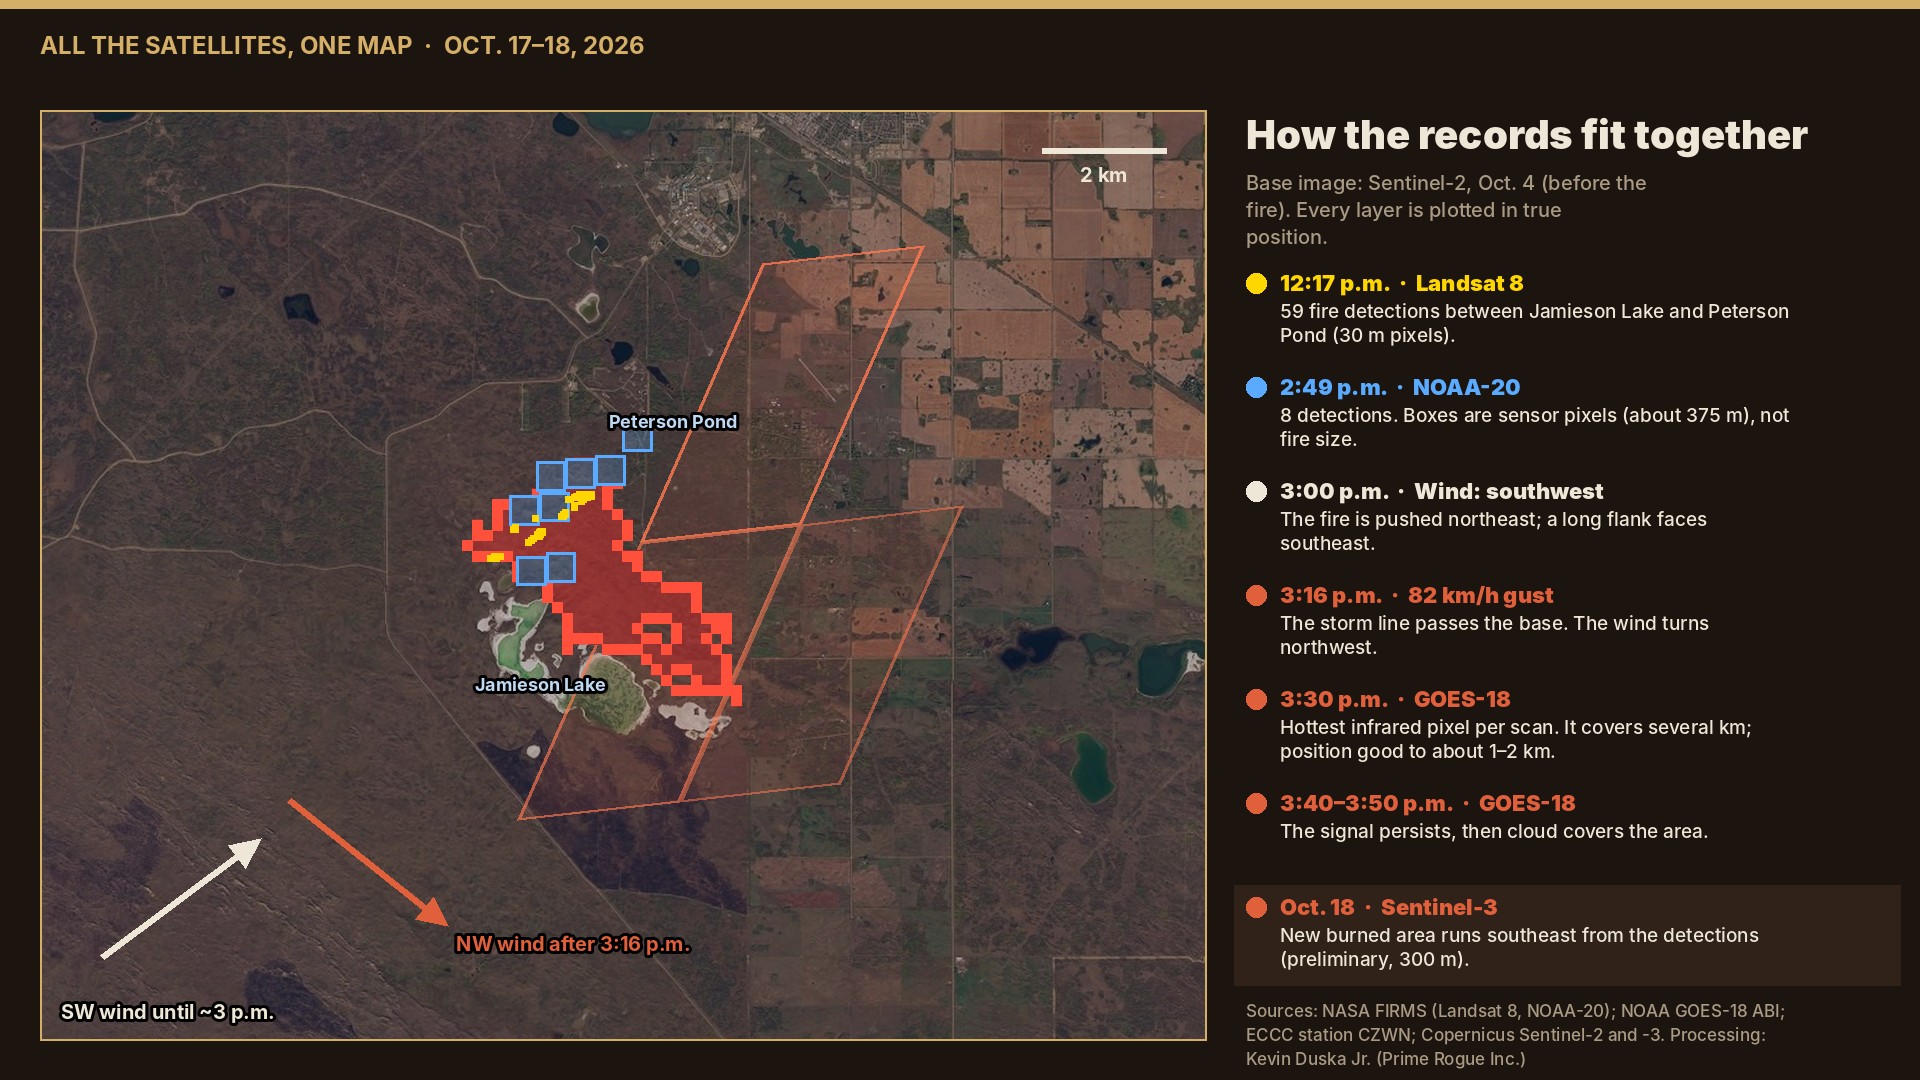
The map puts each record where it belongs, on a cloud-free Sentinel-2 image from Oct. 4. The yellow Landsat points and blue NOAA-20 boxes sit between the two lakes. The wind arrows show southwest air until about 3 p.m., then northwest after the gust. The slanted outline is the hottest GOES-18 pixel at 3:30 p.m., drawn at its true size on the ground. The red patch is the area that darkened between Oct. 4 and Oct. 18.
The GOES pixel sits partly northeast of the burned area. That is expected: GOES positions are accurate to about 1 to 2 km, and heat spills into neighbouring pixels. The burned area itself starts at the detections and runs southeast, which fits a fire turned by a northwest wind.
The CAF memo, as reported, described the wind change as “unexpected and sudden.” On the government’s own records, it was neither.
The release’s account of a fire that “ignited” at about 4 p.m. fares no better. The fire was on the range by 12:17 p.m. and still burning at 2:49 p.m. Maj.-Gen. Wade Rutland said Range Control had known of a fire for several hours, the Edmonton Journal reported. GOES-18 shows fire flaring on the site by 3:30 p.m., half an hour before the release’s time.
We do not allege the account was written to mislead. It is contradicted by the record, and it is still on the government’s website.
There is one piece of the record National Defence could point to. Environment Canada’s 3:05 p.m. bulletin said gusts to 90 km/h were expected “this evening.” The gust came at 3:16 p.m.
If the people running the range relied on that line, they may have believed they had hours, not minutes. That would make the timing a surprise. It would not make the wind unexpected. The 2:14 p.m. forecast said “late this afternoon,” the warning described the storm line itself, and the line was visibly approaching.
We also do not know whether Range Control was watching satellite or radar imagery, or what weather briefing it had received. Those are records National Defence holds, and has not chosen to disclose.
Prime Rogue has put these questions to National Defence and will update this story with any response.
The GOES-18 images were made from NOAA’s raw Level 1b full-disk scans, which are openly available. We used bands 1, 2 and 3 for natural colour, bands 5, 6 and 7 for the fire-temperature view, and band 7 (3.9 microns) for heat. Anyone can download the same files and check our work.
Landsat 8 and NOAA-20 detections are from NASA FIRMS. Wind and temperature are from Environment Canada’s CFB Wainwright station. The burned area compares Copernicus Sentinel-3 images from Oct. 4 and Oct. 18. The base map is Copernicus Sentinel-2 from Oct. 4.
Our full reconstruction of Oct. 17, with 13 graphics and the raw records, is here: Every warning light was on. Follow developments on our live updates page
Sgt. Morgan Wong, Pte. Shaun Farrell, Pte. Aidan Goulding and Pte. Hayden Lykkemark were killed in the fire. 39 Canadian Armed Forces members were injured. CAF Family Information Line (24/7): 1-800-866-4546. Canadian Forces Member Assistance Program: 1-800-268-7708.
 Satellite record fits scenario that an exercise fire was burning before the CFB Wainwright incident
 A week of satellite data on the CFB Wainwright fire: burning by 2:49 p.m., likely since morning
 Satellites saw fire on CFB Wainwright range hours before DND says it ignited
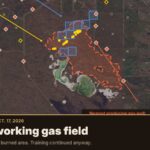 Gas wells played no part in the CFB Wainwright fire, records show


[…] licensed well lies inside the burned area. That area, mapped from Copernicus Sentinel-3 satellite images, is […]