Address
304 North Cardinal St.
Dorchester Center, MA 02124
Work Hours
Monday to Friday: 7AM - 7PM
Weekend: 10AM - 5PM
Address
304 North Cardinal St.
Dorchester Center, MA 02124
Work Hours
Monday to Friday: 7AM - 7PM
Weekend: 10AM - 5PM
The 2022-2024 yield curve inversion was one of the longest on record, setting off alarms across Wall Street. Historically, every major recession since 1955 has been preceded by a yield curve inversion—but under Biden, a full-blown downturn never materialized. The economy bent but never quite broke, and by early 2025, the curve un-inverted as the Federal Reserve cut interest rates for the first time in nearly four years. The crisis, it seemed, had been avoided.
Then, Trump stepped back into office.
Within weeks, his administration unleashed a wave of tariffs on China, Mexico, the European Union, and nearly every major U.S. trading partner. While these moves play well politically and aim to strengthen domestic manufacturing, they directly threaten inflation—which the Fed had only just started to get under control. If inflation spikes again, the Fed could be forced to halt rate cuts—or even hike rates again. And if that happens, the yield curve could rapidly flip back into inversion, signaling yet another recession warning.
This isn’t hypothetical—it’s already beginning. Since Trump’s February 2025 tariff announcement, short-term bond yields have climbed while long-term yields remain flat, a classic early indicator of inversion risk. Meanwhile, the Fed is suddenly caught in a policy trap: continue cutting rates and risk out-of-control inflation, or reverse course and risk killing the fragile recovery.
So, are we on the verge of another inversion? This piece cuts through the noise, breaking down whether Trump’s tariffs, inflationary pressure, and Federal Reserve missteps will trigger another yield curve inversion—and what it means for the economy in late 2025 and beyond.
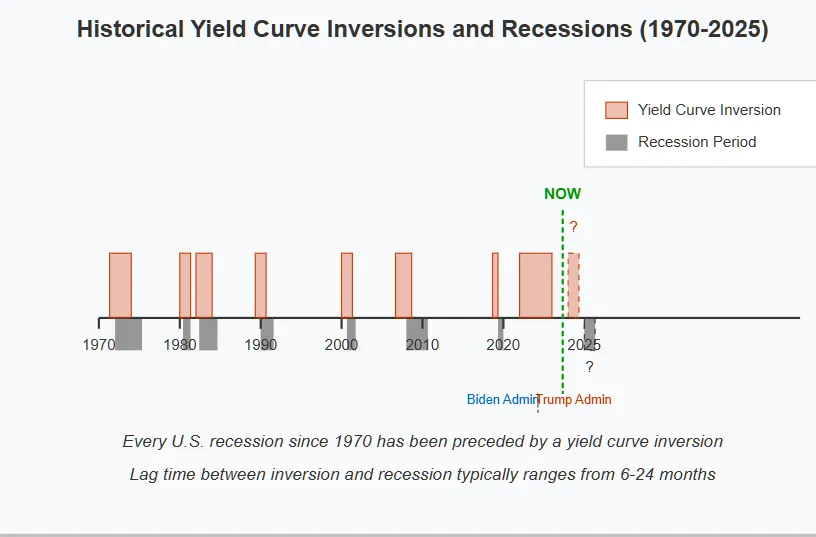
In finance, few signals are as ominous as a yield curve inversion. When it happens, economists, investors, and policymakers take notice—because it has successfully predicted every U.S. recession since 1955, with only one false signal in the mid-1960s.
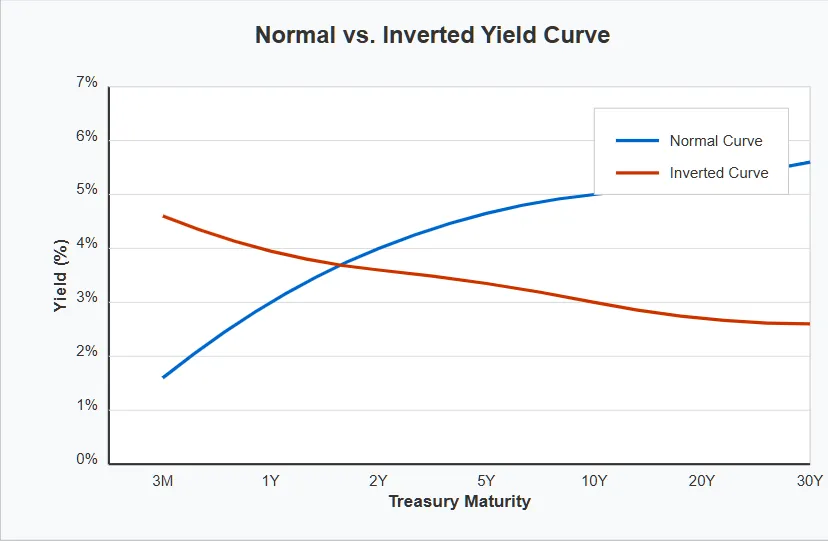
The yield curve is a graph that plots interest rates (yields) on U.S. Treasury bonds of different maturities. Normally, the curve slopes upward because:
This structure reflects confidence in economic growth—higher long-term yields suggest investors expect expansion and inflation down the road.
An inversion happens when short-term bond yields rise above long-term yields. This means investors believe the near-term economy will be worse than the long-term outlook, and they start moving their money into longer-term bonds as a safe haven.
For example, in an inversion scenario:
Yield curve inversions happen when markets expect the Federal Reserve to make a policy mistake—either by keeping interest rates too high for too long or by overcorrecting after an inflation surge.
When short-term borrowing costs rise (due to high Fed rates) but long-term confidence falls (because investors fear a slowdown), businesses pull back on spending, credit markets tighten, and consumer demand weakens. The result? A recession typically follows within 12-24 months.
The most recent inversion began in October 2022 and lasted until December 2024—more than two years, one of the longest in U.S. history. This occurred under Biden’s presidency, driven by:
However, a full recession never materialized—GDP growth slowed but remained positive, and labor markets held up better than expected. This led some analysts to argue that the yield curve inversion had lost its predictive power.
Now, as of early 2025, the curve has returned to normal—but with Trump’s economic policies, it may not stay that way for long. If inflation re-accelerates due to tariffs, the Fed may be forced to raise rates again, pushing the yield curve back into inversion and renewing recession fears.
With that context in mind, let’s break down exactly how Trump’s tariff-heavy economic policy could be the trigger for another inversion in late 2025 or early 2026.
When the U.S. yield curve inverted in October 2022, financial analysts and economists sounded the alarm. Every recession since 1955 had been preceded by an inversion, and this one was particularly severe. At its peak, the spread between the 2-year and 10-year Treasury bonds was more than -100 basis points, one of the deepest inversions in recorded history.
For over two years, the warning light flashed bright red—yet the economy never fully collapsed. Why?
The Key Drivers of the 2022-2024 Inversion
The inversion was driven by three major factors, all occurring under Biden’s presidency:
How the Inversion Ended in December 2024
By the end of 2024, the yield curve finally normalized as the Fed pivoted to rate cuts:
The Federal Reserve seemed to have engineered a soft landing—no deep recession, just slower growth. But that’s when Trump took office, and everything changed.
Now, with new economic uncertainty driven by trade policy, there’s a real risk that the curve could invert again in late 2025 or early 2026. Let’s examine how Trump’s tariffs might force the Fed’s hand—and send the economy back into inversion territory.
In his first few weeks back in office, Trump wasted no time reigniting his trade war playbook—but this time, the stakes are even higher. On February 5, 2025, his administration announced a sweeping tariff package that sent shockwaves through global markets. Unlike his first term, when tariffs were primarily targeted at China, this new wave of protectionism is broader, deeper, and potentially far more inflationary.
Here’s what has been enacted so far:
The message is clear: Trump wants to reduce U.S. reliance on foreign manufacturing and boost domestic production.
In theory, tariffs are supposed to protect American industries by making imported goods more expensive, forcing businesses to buy domestically. But in reality, they act as a tax on consumers and businesses, increasing prices across the board.
The last time Trump introduced tariffs in 2018-2019, inflation barely budged because overall demand was still moderate. But now, the economy is running hot, and any additional price pressure could force the Fed into a difficult position.
This is exactly the kind of scenario that could force the Federal Reserve to reverse course—and it’s why the risk of a second yield curve inversion in 2025-2026 is rising rapidly.
With inflation heating up again, let’s examine the trap the Fed now finds itself in—and why it may have to choose between letting inflation run wild or triggering another economic downturn.
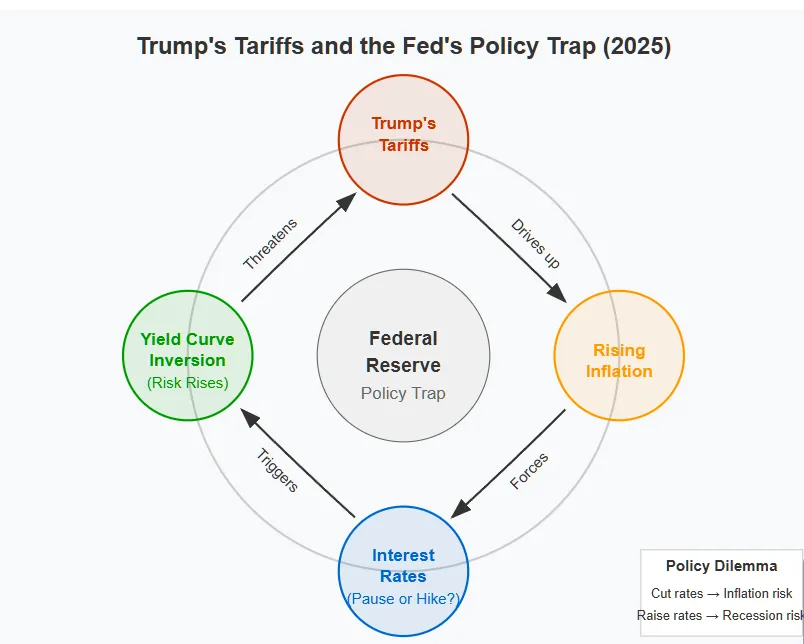
As Trump’s tariffs drive up costs and inflation reaccelerates, the Federal Reserve finds itself in a policy trap—one with no easy way out.
Just months ago, the Fed was in full “soft landing” mode, having begun cutting rates in December 2024 after inflation had cooled. But now, with tariffs acting as an inflationary shock, the central bank’s path forward is suddenly unclear.
Now, Fed Chair Jerome Powell has two options—both bad:
Option 1: Keep Cutting Rates and Risk Runaway Inflation
Option 2: Pause or Hike Rates and Risk a Recession
If short-term rates keep rising due to Fed hesitation while long-term bond yields stay flat or fall, the curve could invert again before the end of 2025.
The bond market is starting to call the Fed’s bluff. If inflation keeps climbing and Powell is forced to halt or reverse course on rate cuts, another inversion could be just months away.
Next, let’s analyze how bond traders and institutional investors are positioning themselves—and whether the market is already preparing for another downturn signal.
Bond traders have a reputation for seeing economic shifts before the rest of the market does—and right now, they’re sending early warning signals that another yield curve inversion may be on the horizon.
The bond market’s reaction to Trump’s tariffs has been swift and significant. Since the February 5, 2025, announcement of sweeping trade restrictions, we’ve seen:
These movements reflect a growing concern: Inflationary pressure from tariffs may force the Fed to halt or reverse its rate-cutting cycle.
The next section will examine whether Trump’s overall economic strategy is sustainable—or if we’re heading straight toward stagflation or a full-blown recession.
Trump’s economic strategy is built on a high-risk, high-reward bet: that aggressive trade protectionism and domestic manufacturing incentives will stimulate the U.S. economy without triggering a recession. But history suggests that tariffs often do more harm than good, and the bond market is already flashing warning signs that the gamble may not pay off.
Since returning to office, Trump has made economic nationalism his top priority, arguing that:
This was the same playbook he ran in 2018-2019, but with two major differences:
If Trump’s tariffs push inflation higher, the Fed must choose between two bad options:
The Best-Case Scenario (Low Probability)
The Worst-Case Scenario (More Likely)
The final section will bring everything together—is another inversion inevitable? Or does Trump’s gamble actually have a chance of working?
The first yield curve inversion (2022-2024) happened under Biden, driven by the Fed’s aggressive rate hikes to fight inflation. It lasted over two years—one of the longest inversions in history—but despite the warning, the economy never fully collapsed into a deep recession. By early 2025, the curve un-inverted as the Federal Reserve started cutting rates, aiming for a soft landing.
Now, Trump’s policies are changing the game again. His tariff war is injecting new inflationary pressure, making it harder for the Fed to continue cutting rates as planned. The bond market is already reacting, with short-term yields climbing while long-term yields remain stagnant—an early sign that another inversion may be on the way.
The risk of a second inversion in 2025-2026 is high—higher than most economists currently expect. If the Fed pauses or reverses rate cuts, we will likely see another inversion before the end of the year.
This time, the warning might not be ignored. A second inversion so soon after the last one would be unprecedented—and history suggests that when markets send the same distress signal twice in rapid succession, policymakers don’t get a third chance to fix it before a recession hits.
Investors should watch inflation data, the Fed’s next moves, and the bond market spread closely. If another inversion comes, it won’t just be another red flag—it will be the final warning before the economy finally tips into a downturn.
 America First? More Like Refinery Last—Trump Oil Tariffs Just Handed Alberta the Market
 Is the Trump White House Engineering a Recession? A Hard Look at the Data
 Norway’s Thorium Reserves: Strategic Implications in a Trump Administration
 The Fed Versus the MAGA State: What Happens If Trump Fires Jerome Powell?
[…] In early 2025, the second-term Trump administration triggered a renewed tariff war, targeting Canadi…In response, Canada imposed countermeasures. The situation deteriorated. […]
[…] it won’t be judged by its Constitution — it will be judged by its credibility. And in the sovereign bond market, credibility is […]
[…] is the problem. Framing the crisis as a response to Trump — to his tariffs, his annexation rhetoric, his coercive negotiating posture — implies that a different American […]