Address
304 North Cardinal St.
Dorchester Center, MA 02124
Work Hours
Monday to Friday: 7AM - 7PM
Weekend: 10AM - 5PM
Address
304 North Cardinal St.
Dorchester Center, MA 02124
Work Hours
Monday to Friday: 7AM - 7PM
Weekend: 10AM - 5PM
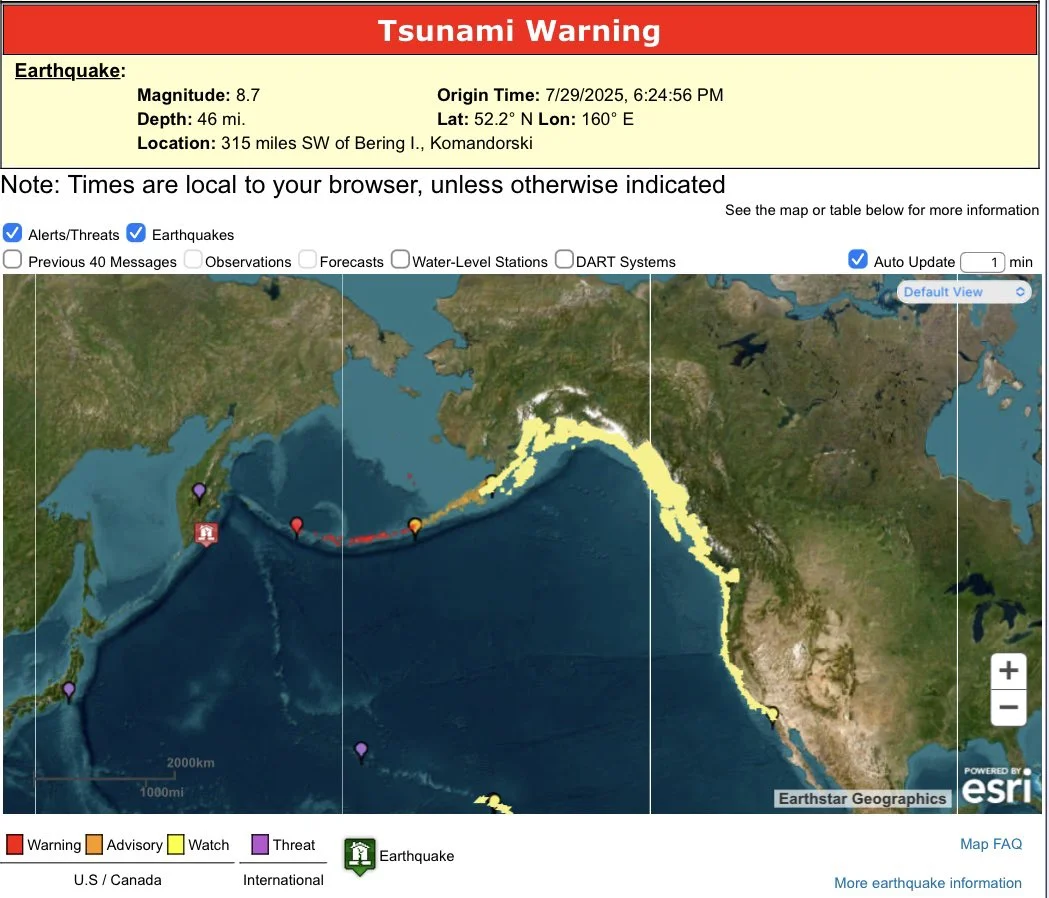
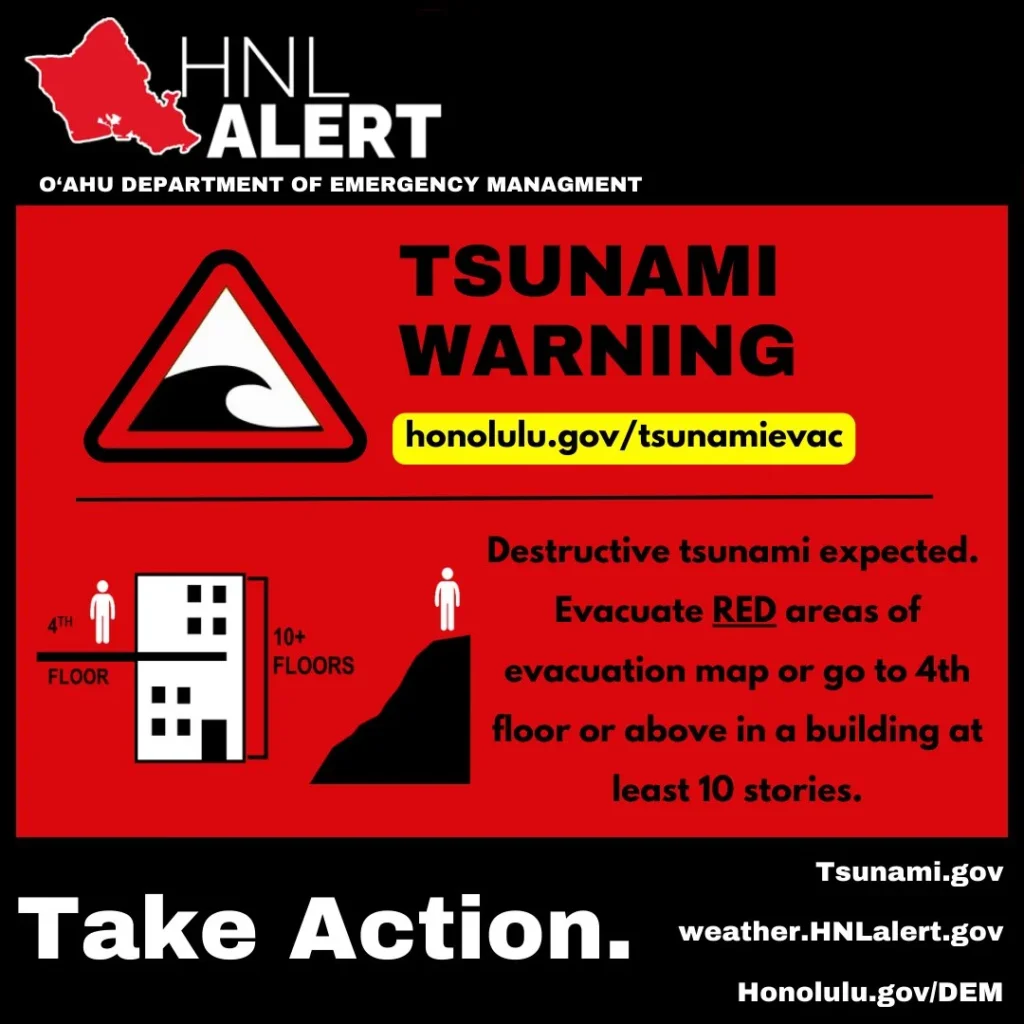
On July 29, 2025, at approximately 17:46 local time, a magnitude 8.7 earthquake struck off the eastern coast of Russia’s Kamchatka Peninsula. Within minutes, tsunami warnings and watches rippled across the Pacific Ocean, triggering sirens in parts of Japan, Alaska, and Hawaii. Coastal cities braced for impact. Buoys in the Bering Sea twitched. Social media melted down. And yet — the real danger may not be over.
Despite the immediate headlines and initial wave activity, seismologists and OSINT analysts alike are now warning that this might not have been the main event. Instead, there’s growing concern that this powerful quake was not an isolated rupture, but a foreshock — a geological prelude to something even larger. Historical precedent suggests that massive earthquakes like this can destabilize adjacent fault zones, trigger aftershocks of equal or greater magnitude, and spawn secondary tsunami waves long after the first alert fades.
With much of the Pacific still on edge and modeling data trickling in, the question now isn’t just “what happened?” but “what happens next?” Was the Kamchatka earthquake just the start of a seismic chain reaction? Could the real tsunami threat be yet to come?
This OSINT-driven breakdown cuts through the panic, noise, and bureaucratic hedging to assess the actual risks — from aftershock probabilities and tectonic unzipping to cascading faultline scenarios across the Pacific Rim. If you’re looking for the real signal beneath the seismic noise, start here.
When the ground shakes, most people think in singular terms: “the earthquake.” But geologists often speak in sequences — foreshock, mainshock, and aftershock — and getting those labels right can be the difference between understanding the risk and sleepwalking into catastrophe.
A foreshock is a smaller-to-major earthquake that precedes a larger seismic event — the mainshock — in the same general area. What makes them tricky is this: you never know something was a foreshock until the mainshock hits. In other words, a magnitude 8.7 quake like the one near Kamchatka could feel like the climax, but if the fault line is only partially ruptured, it may be just the opening act.
Seismologists now understand that foreshocks often occur along “locked” segments of subduction zones — massive slabs of tectonic crust that have stopped moving but are building up pressure. When that pressure releases partially, it can destabilize adjacent areas and set off progressive ruptures. This domino effect is known as stress transfer — and Kamchatka’s quake just pulled the pin.
If the Kamchatka event was a foreshock rather than a full release, then the real quake — potentially even larger — may follow within hours, days, or weeks. And because the region sits in one of the world’s most tsunami-prone basins, any new rupture could generate waves with little to no warning, especially if it occurs closer to Japan, the Kurils, or the Aleutian chain.
The takeaway? Don’t just measure earthquakes by magnitude — measure them by sequence. This story might still be unfolding.
The July 29, 2025 Kamchatka earthquake was no ordinary tremor. Clocking in at a magnitude of 8.7 and originating at a depth of approximately 19 kilometers, this was a megathrust earthquake—the most powerful class of seismic event known to occur along subduction zones. Specifically, this quake occurred where the Pacific Plate plunges beneath the Okhotsk Plate, a subsegment of the broader North American Plate. That region is part of the notorious Pacific Ring of Fire, a violent horseshoe of tectonic volatility responsible for 75% of the world’s active volcanoes and 90% of its largest earthquakes.
What makes this event particularly alarming is its tectonic geometry. Kamchatka’s subduction trench shares stress boundaries with multiple seismic hotspots:
In lay terms: this quake happened in a zone that links at least three major stress reservoirs. When one slips, the rest may shift in response.
That’s the $10 billion question. If the quake represented a complete release of built-up stress, it might mark the end of the seismic sequence. But if it only ruptured a portion of the locked fault — say, the upper third or middle belt — it could actually increase pressure on adjacent segments, setting the stage for a larger or follow-on quake.
This is what happened in Japan in 2011: the initial rupture triggered additional movement to the south and ultimately unzipped the trench like a zipper pulled too far.
Bottom line: The Kamchatka quake wasn’t just huge — it was strategically placed in tectonic terms. And whether it sealed pressure or shifted it somewhere worse is still unclear.
The earth doesn’t just shake once and go quiet. After a quake as powerful as the 8.7 Kamchatka event, the crust enters a period of seismic instability that can last days, weeks, or even months. This is the aftershock window, and it’s where patterns emerge—or where catastrophe can follow.
According to the U.S. Geological Survey (USGS) and regional seismological networks, the likelihood of significant aftershocks—defined as magnitude 7.0 or greater—is very high in the first 72 hours. The rupture zone has already produced dozens of smaller quakes (M4.5–5.9), and more are being recorded by the hour.
| Event Type | 72-Hour Likelihood | 7-Day Likelihood |
|---|---|---|
| M ≥ 7.0 Aftershock | 80–90% | 90–95% |
| M ≥ 7.5 Aftershock | 20–25% | 30–35% |
| Secondary M ≥ 8.0 Earthquake | 10–15% | 15–20% |
| Larger “Mainshock” (Foreshock Scenario) | 5–10% | 10–12% |
While these numbers might seem low for the larger events, a 5–10% chance of a bigger quake is statistically huge in seismology, especially for populated coastal areas.
Here’s what an open-source intelligence analyst—or even a savvy observer—should be watching right now:
Most people assume that once the first tsunami hits, the danger is over. But in some of the most devastating disasters on record—Sumatra 2004, Japan 2011, Chile 2010—the deadliest waves didn’t come first, or even from the first quake. They came later, triggered by secondary earthquakes or cascading fault ruptures that occurred after the main alert had faded.
Now, in the wake of the July 2025 Kamchatka quake, that scenario isn’t just theoretical. It’s actively being modeled.
Real tsunami threats aren’t just detected by governments — they’re flagged early by a mix of open data, machine inference, and crowd-sourced anomaly detection. Here’s what to track:
One study of the 2010 Chile earthquake found that the second tsunami wave, arriving 36 minutes after the first, caused over 75% of the fatalities—mainly among those who had re-entered low-lying zones.
While no official “second tsunami” has occurred yet, the tectonic setup remains primed. And in tsunami warfare, the ocean doesn’t repeat itself—it escalates.
While official agencies like the USGS, Japan Meteorological Agency (JMA), and the Pacific Tsunami Warning Center (PTWC) provide crucial updates, open-source intelligence (OSINT) offers a faster, more decentralized layer of situational awareness. And right now, that layer is flashing red.
From satellite deformation maps to live buoy data, open-source analysts and seismologists are assembling a picture that suggests the July 2025 Kamchatka earthquake may not have completed the rupture cycle. Here’s what the data shows:
Open-source modeling now supports a scenario in which:
In intelligence terms: this is not a post-crisis landscape. It’s a prelude to either stabilization or escalation, and OSINT is ahead of most official reporting cycles.
If you want to follow this threat yourself, these free resources offer cutting-edge, real-time insight:
| Tool | What It Does |
|---|---|
| EMSC-CSEM | Live seismic maps with aftershock clustering |
| NOAA/NWS Tsunami Buoy Data | Raw sea level readings from deep ocean |
| Sentinel Hub EO Browser | Satellite interferometry (use displacement layers) |
| MarineTraffic & ADS-B Exchange | Track military/naval repositioning |
| Telegram (@earthquake_rus, @JMA_bot) | Regional seismic alert proxies |
| IRIS Seismic Event Dashboard | Educational-grade but reliable modeling |
 Emergency Plans for Possible Attacks Tomorrow
 The Bureaucratic Killbox: How to Collapse USAID, AI Ethics Grifters & Narrative Control in Real Time
 The Military Industrial Complex is Real, Part 1
 The G7 Fortress: Threat Vectors, Cyber Pressure, and the Disinformation Battlespace – 2025 G7 Security Series #6
The historical context is chilling. If this was a foreshock, I can only imagine how much more devastating a full-scale earthquake could be. This is exactly why we need to stay vigilant and not assume the worst is over.
Землетрясение было ужасным. Я приехал, и большая часть деревни теперь затоплена морем. Спасибо, что написали.
Your blog is a constant source of inspiration for me. Your passion for your subject matter shines through in every post, and it’s clear that you genuinely care about making a positive impact on your readers.
Love the GEOSINT – well done ser.